Acceptance Quality Limit
Meaning ~ Acceptance quality limit represents the maximum percentage of defective items permitted in a lot for it to pass attribute sampling inspection at the factory.

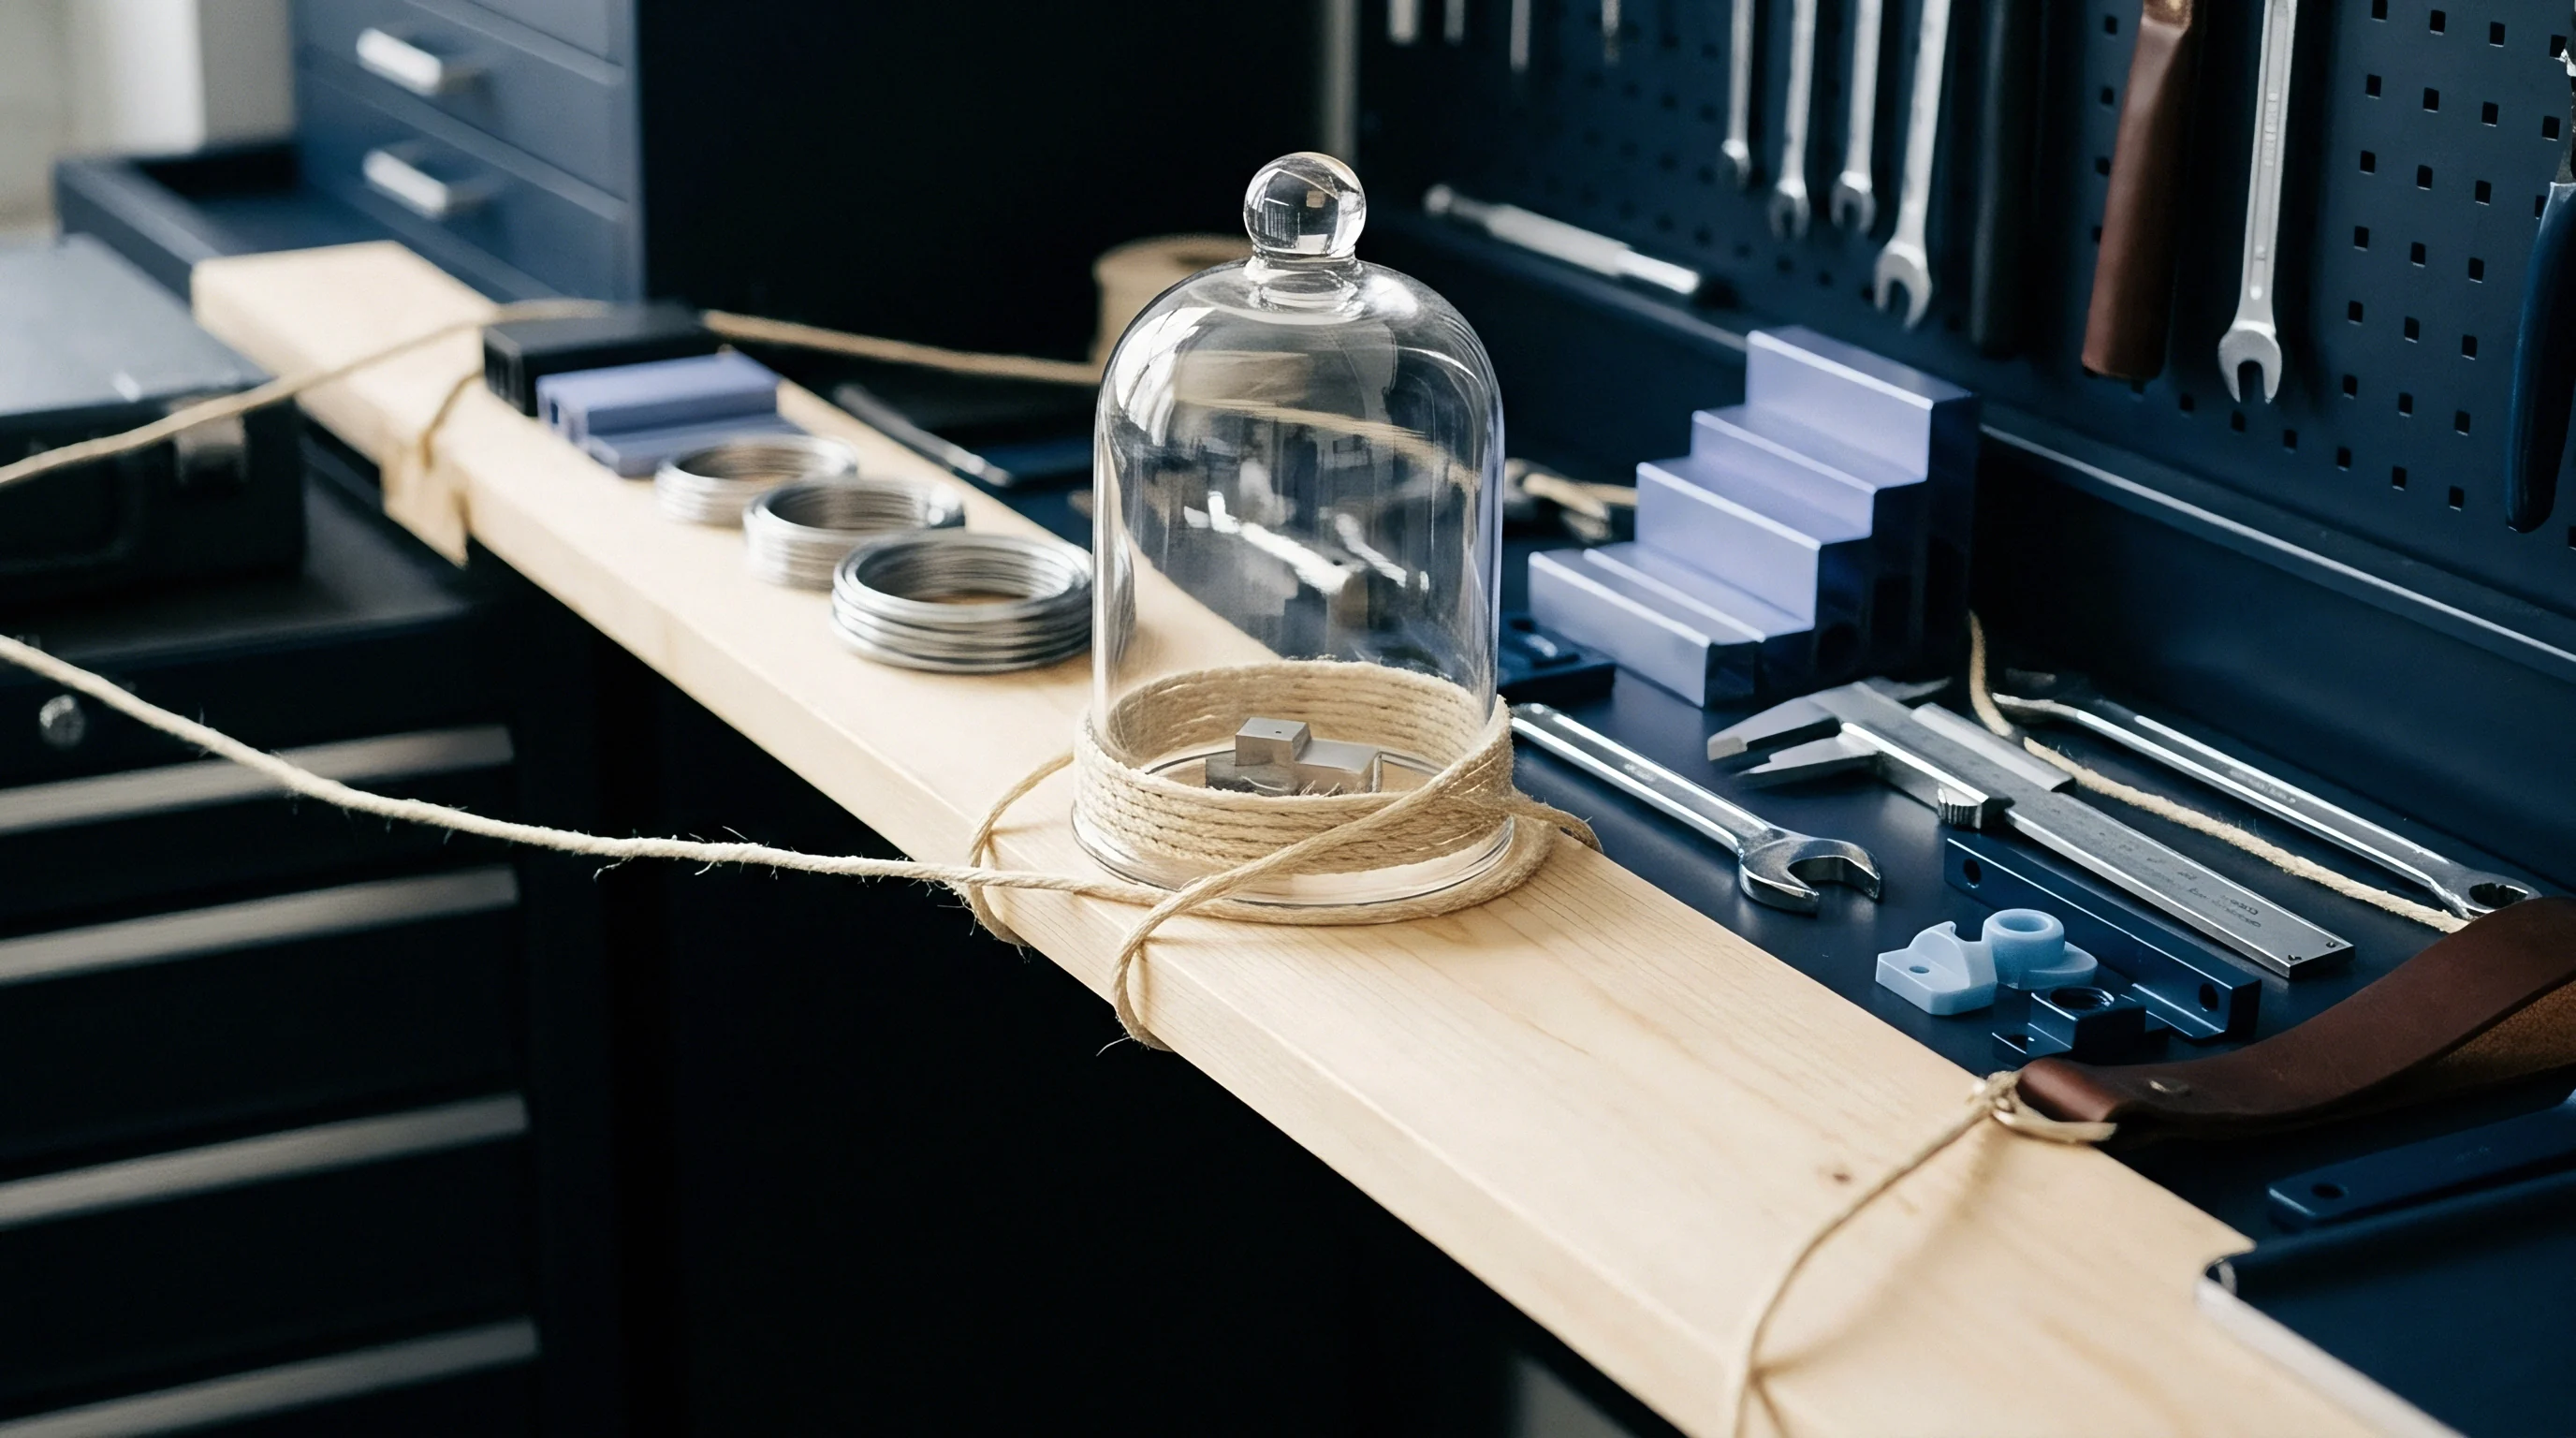
Bench
An acceptance quality limit sets the maximum number of defective items allowed in a sample for a production lot to pass inspection. It splits risk between manufacturer and importer, marking exactly how many nonconforming units can appear in a random pull before the entire lot is turned away. The metric relies on attribute sampling ~ an item either meets the specification or fails it, with no middle ground.
That distinction turns broad quality expectations into fixed mathematical cutoffs for inspectors clearing goods on the floor.
The limit usually forms part of an inspection protocol tied to international standards like ISO 2859-1 or ANSI/ASQ Z1.4. It stops applying once goods move beyond the visual or dimensional checks in the purchase agreement and into full functional testing. Importers use this boundary to protect against widespread defects, knowing high-volume factory lines almost never hit zero faults across millions of items.
Reaching that sample cutoff shifts the decision from a debate over quality to a binding contractual call.
An inspector’s shift comes down to a clear outcome: the lot exceeds the rejection number or stays within bounds.
Sensitivity depends on the chosen inspection level, which determines how many pieces come out of the crates. On eight thousand outdoor wireless chargers, a level II plan means pulling exactly two hundred units. With an acceptance quality limit of 1.5 percent for major defects, seven defective units pass the lot, while eight trigger a failed report.
A single defect decides whether forty pallets move to the dock or remain behind for complete sorting ~ a boundary that gets tense at the bench when the count reaches seven with three cartons left.
A lot containing more than the specified acceptance number falls into a pending status where the factory holds the financial burden of rework or replacement.
Factories often treat this threshold as breathing room for material variance or minor assembly shifts. Buyers treat it as their final guard against defective goods reaching retail shelves. Standard inspection tables settle any disagreement between the two.
Inspecting 100 percent of a run is financially impossible for most low-margin goods, leaving statistical sampling as the only practical option. That compromise ends where safety-critical hardware begins; life safety equipment bypasses statistical sampling for total verification or zero-tolerance testing.
Setting the limit means balancing producer’s risk against consumer’s risk. A factory risks having a good lot rejected due to an unlucky sample; a buyer risks receiving a bad lot if inspectors pull from a clean corner of the shipment. Pre-agreed numbers resolve that tension before production starts.
Without an explicit cutoff, contract quality clauses stay vague, leaving little leverage if money needs to be recovered. Is the current threshold tight enough to catch the component drift showing up in the latest circuit boards?

Arithmetic
Sampling calculations rely on standard tables that match total order quantities to sample sizes and pass-fail cutoffs. The process starts with the lot size, which sets the starting row in ANSI/ASQ charts. Every distinct SKU in a container counts as its own lot with its own inspection and result ~ so a clean run of blue shirts cannot mask a bad batch of red shirts sitting in the same shipment.
The buyer picks a code letter based on the required strictness, then reads the exact numerical limits off the master table.
Misreading this math causes frequent clearing discrepancies at the loading dock. Factories often assume an allowable defect count covers all defects combined, but the standard enforces separate limits for each category. Major defects run on tighter thresholds like 1.0 or 1.5, while minor cosmetic flaws might allow 4.0 or more.
That separation concentrates inspection effort where flaws actually impair function or ruin retail presentation.
| Lot Size Range | Code Letter | Sample Size | AQL 1.0 (Ac/Re) | AQL 2.5 (Ac/Re) | AQL 4.0 (Ac/Re) |
|---|---|---|---|---|---|
| 3201 to 10000 | L | 200 | 5 / 6 | 10 / 11 | 14 / 15 |
| 10001 to 35000 | M | 315 | 7 / 8 | 14 / 15 | 21 / 22 |
| 35001 to 150000 | N | 500 | 10 / 11 | 21 / 22 | 30 / 31 |
Shifting a limit down from 2.5 to 1.0 either grows the necessary sample size or shrinks the allowable defect count. In the table above, an order of 5,000 units inspected at a 1.0 limit allows five failures; at 2.5, that tolerance doubles. The shift changes how quickly sporadic assembly glitches or systemic line faults surface.
Buyers push for tighter limits during the product development phase to force suppliers into tighter process controls early. The targets on paper reflect how stable the factory floor actually is.
Lookup tables tell inspectors exactly how many samples to pull for validation. If the sample size is 200, every single piece must be pulled, unpacked, checked, and logged. That labor cost lands on the buyer paying an inspection agency or the factory allocating floor space and crew.
Getting this wrong at the quote stage leads to under-inspecting and missing major flaws, or overpaying for auditors to sit in a warehouse. Experienced procurement teams treat the tables as fixed contract terms to avoid debates over what constitutes an acceptable flaw rate.
A lot passes only when observed nonconformities stay at or below the figure in the Ac column of the lookup chart.
The tables built in options for different levels of sampling rigor, moving between reduced, normal, and tightened inspection plans. A factory with a clean track record can move to reduced sampling to cut inspection time and cost. If several consecutive lots fail, the contract triggers tightened inspection, lowering defect thresholds and increasing sample sizes.
This mechanism relies on the same statistical framework to manage supply chain risk while avoiding full 100 percent sorting costs where performance remains steady.
The rule stays simple: exceed the limit by one defective unit, and the whole shipment stops.

Fault
Sampling math means little without clear defect definitions. Without a detailed defect classification list, target numbers carry almost no practical weight. Inspectors divide issues into three categories based on function, safety, and retail appearance.
The acceptance quality limit for critical defects sits near zero, meaning a single critical flaw fails the batch outright. That strictness protects consumers from safety hazards and importers from legal liability.
Major defects render an item unfit for use or depart far enough from spec to cause retail returns ~ a zipper jamming on first pull, or a motor that fails to start. Minor defects are cosmetic, like mismatched stitching thread or faint scratches inside a housing. Minor flaws rarely ruin function, but high counts signal sloppy finished goods handling and broader operational slips across the assembly line.
- Applying an acceptance quality limit starts with establishing a clear visual standard that compares production units against a master sample.
- Report fields for the acceptance quality limit log specific measurement deviations, showing engineers exactly where line tolerances slipped.
- Evaluating the acceptance quality limit relies on the weighted importance of faults, so three minor cosmetic flaws never equal one major failure.
- Setting an acceptance quality limit for electronics focuses on functional consistency across automated test routines.
An explicit defect list must accompany the purchase order for limits to stand up under pressure. On 10,000 cast iron skillets arriving at the port, inspection hinges on how pitting depth is categorized. If pits deeper than two millimeters count as major defects under a 1.5 limit, an inspector checking a sample of 200 can accept eight defective skillets, whereas a ninth rejects the batch.
Disagreements quickly follow when surface pits measure 1.9 millimeters, sparking arguments over caliper calibration at the bench.
Classification accuracy ensures the tally reflects commercial viability rather than an inspector’s personal mood.
Factories sometimes try reclassifying minor defects as routine observations so they stay off the main tally. The goal is keeping counts below the threshold to avoid costly line restarts or manual re-sorting. Importers counter this by holding strictly to the signed defect dictionary.
That document ends arguments, making sure an oil spot on a garment counts against the total if washing it damages the fabric. Standardizing how defects are logged across inspectors keeps historical quality data dependable.
The balance between how defects are categorized and where thresholds are set establishes the real quality baseline on the shop floor.

Dock
Releasing goods to an export terminal depends on the outcome logged in the inspection certificate. A failed result against agreed quality limits stops shipments right at the factory gates. That prevents defective goods from reaching the port, where legal ownership transfers to the buyer under FOB terms.
The financial rule remains strict: no passing certificate means no loading and no payout until issues are cleared.
The export dock is where buyers face their highest financial exposure. Delays mean missed retail windows, while bad product destroys brand reputation. Setting a firm hard stop at origin gives the importer maximum leverage while goods remain under factory control.
Resolving defect issues post-import costs roughly ten times more than catching them before export, once customs duties, ocean freight, drayage, and return shipping are added up.
Enforceable thresholds serve as an effective check against bad-faith shipping. Knowing an independent auditor will pull 200 items at random forces plant managers to maintain tighter control over assembly lines. When a sample fails, factories often offer to re-sort or rework goods on-site to preserve shipping dates.
Importers can agree ~ provided rework introduces no secondary damage ~ though the contract must require a full re-inspection afterward. The final random inspection report stays in the record as evidence of due diligence if safety or performance claims surface down the line.
| Cost Component | Rejection at Factory | Rejection at Import Port | Responsibility Shift |
|---|---|---|---|
| Inspection Fee | $300 | $1,500 | Buyer vs specialized surveyor |
| Rework Labor | Factory cost | $45.00 / hour | Local warehouse team |
| Logistics Loss | Zero (on hold) | $2,200 (re-export) | Importer covers initially |
| Tariff/Duties | Not filed | Paid and non-refundable | Customs administration |
The economic comparison shows why resolving quality issues at origin matters so much. Intercepting a run of poorly bonded boots before loading saves thousands in non-refundable freight and customs duties. Buyers enforce this with strict contract terms that prohibit cargo movements without a signed pass report.
If a factory tries booking container space before testing finishes, it is attempting to force a done deal. Tying letter-of-credit releases to the inspection certificate blocks that tactic cold.
A physical blockade at origin remains the only cost-effective way to manage high-defect inventory.
Tight dock deadlines bring predictable requests for leniency when defect counts miss targets by a small margin. Suppliers often argue that cargo is urgent and that buyers will not notice minor variations. Best practice treats the cutoff as a strict, unyielding binary.
If the chart sets eight as the rejection count, nine fails the lot. Waiving limits even once signals that standards are negotiable, opening the door to steady quality drift on future runs.
Sealing a container before an auditor arrives prevents drawing a valid random sample and invalidates the inspection.
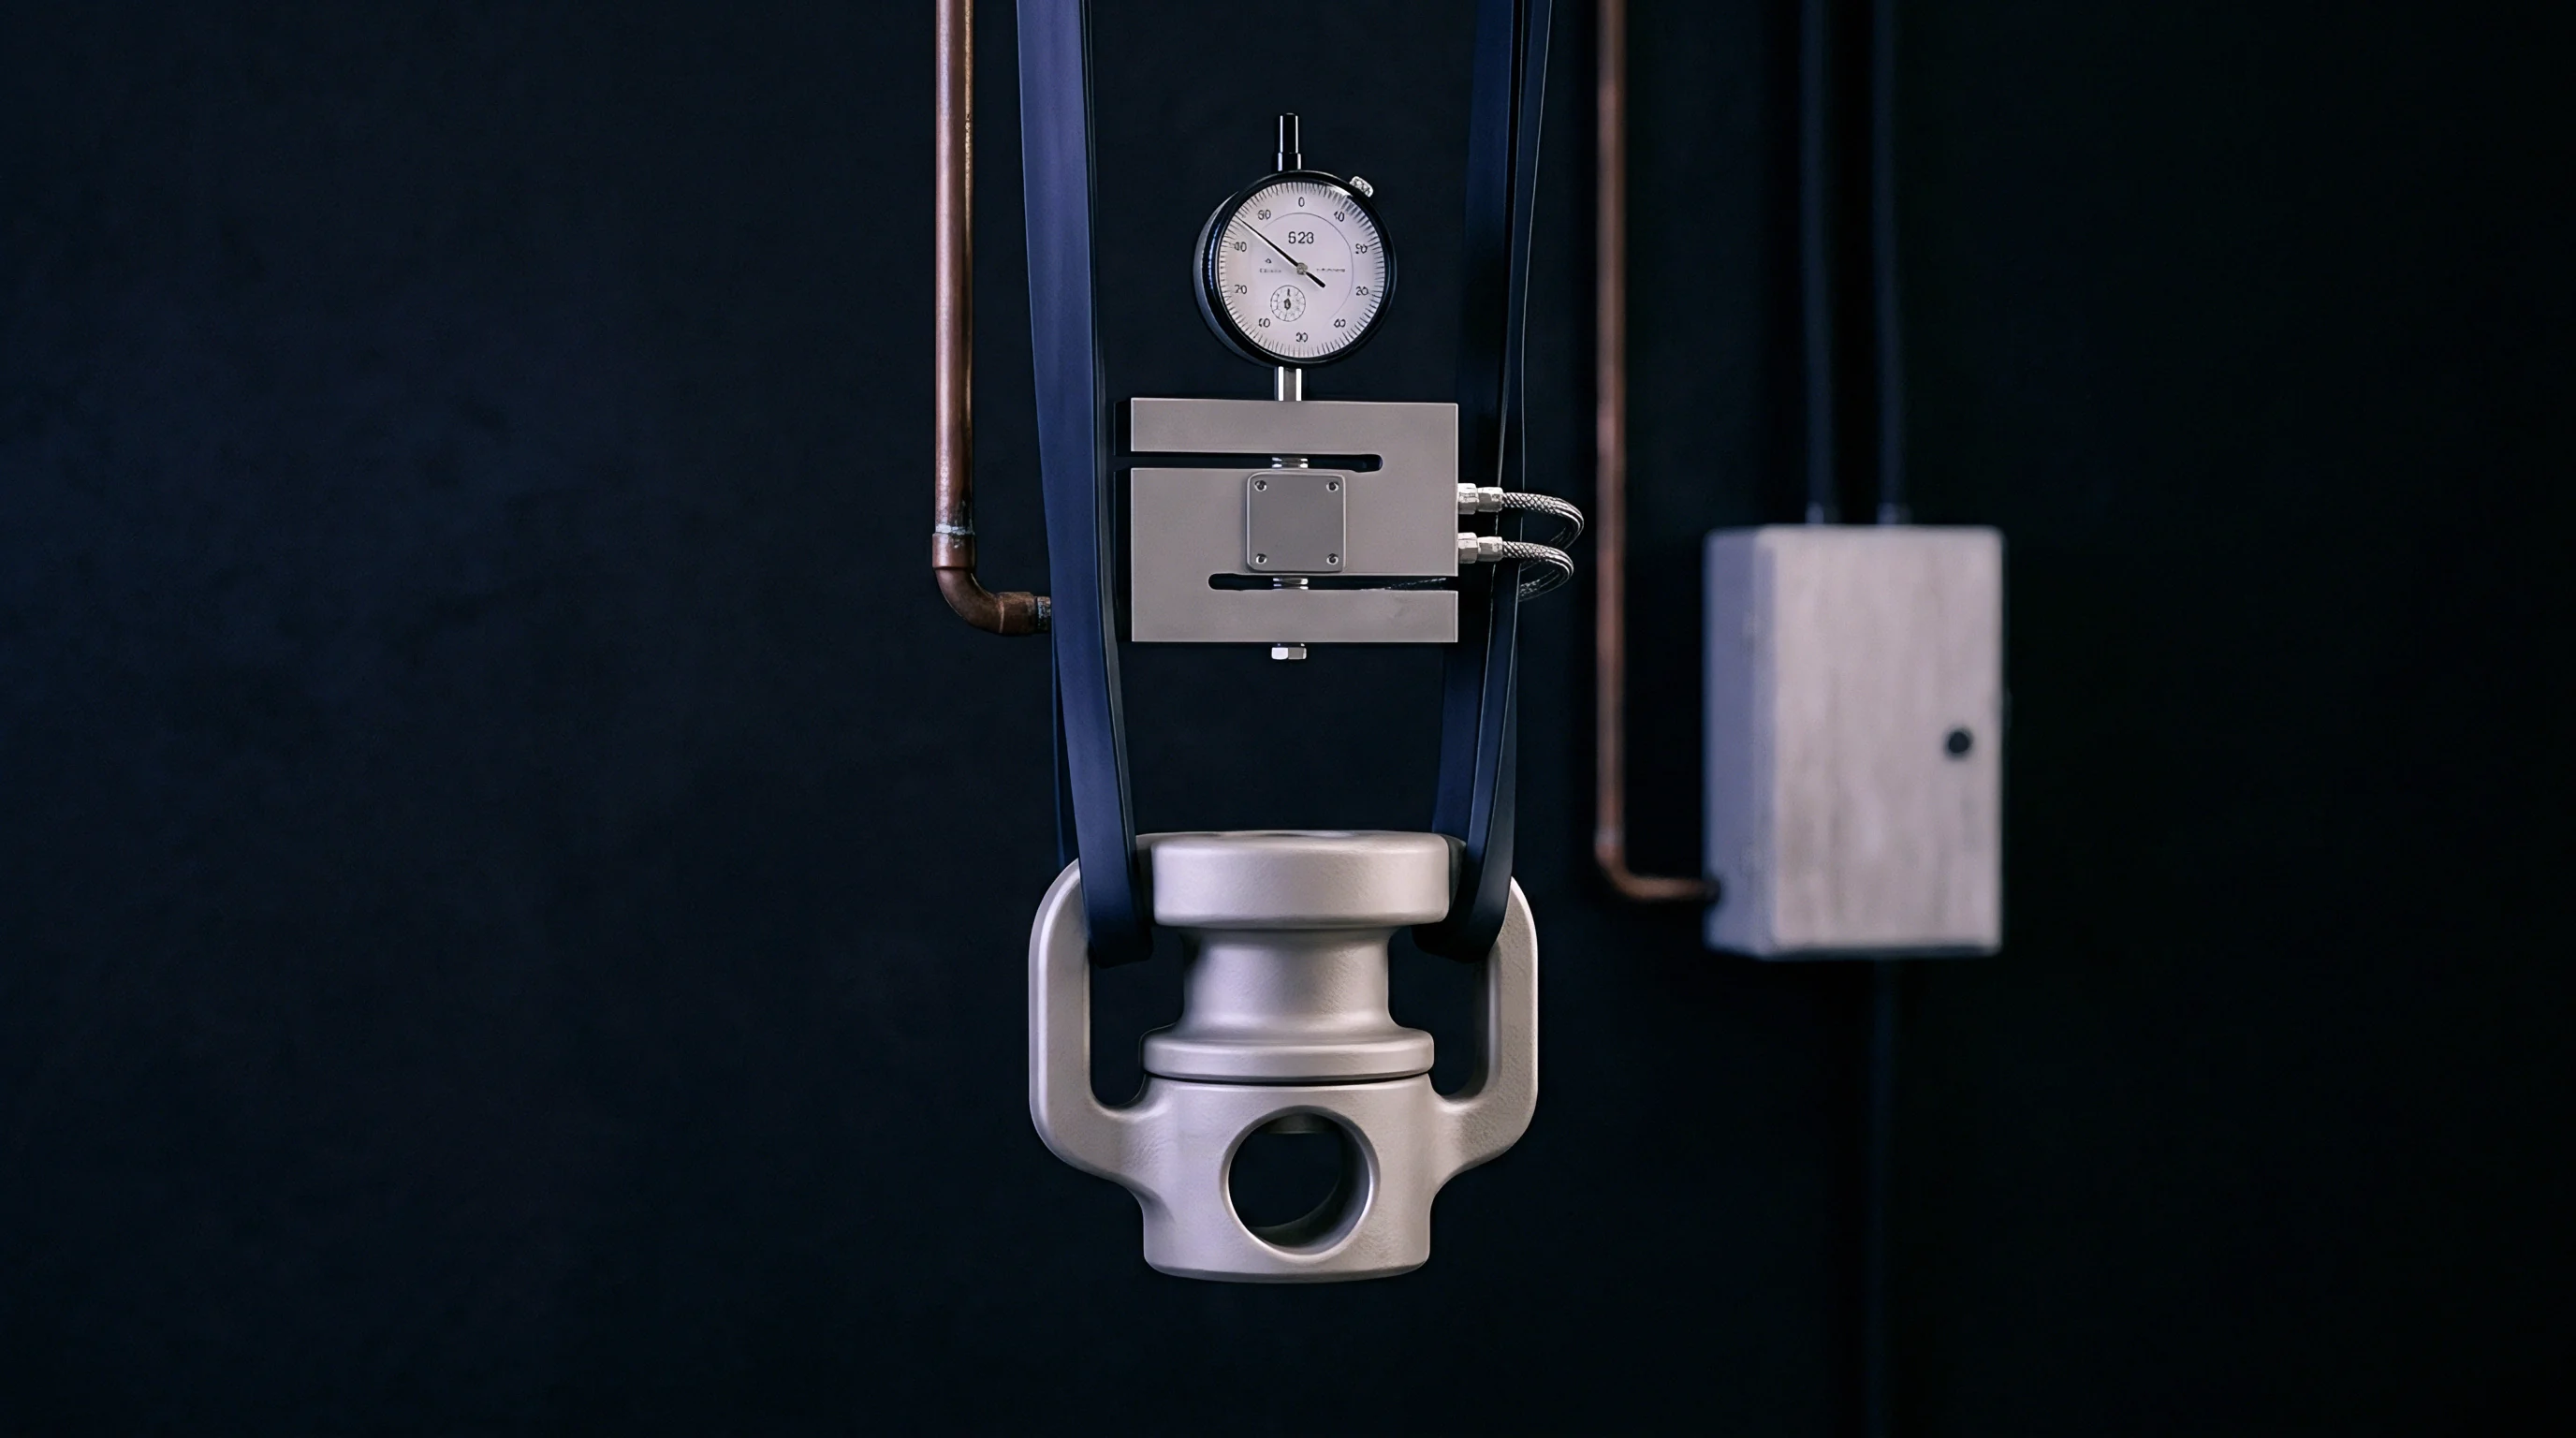
Paperwork
Sampling parameters belong directly in the initial purchase order to create an enforceable quality standard. Broad terms like “standard commercial quality” offer almost no legal standing when five percent of an order arrives broken. Binding contracts define the exact standard, inspection level, and numerical cutoffs for critical, major, and minor defects.
That clarity allows factories to price quotes accurately, knowing tighter limits require higher-grade component sourcing and slower assembly.
When defects surface, the formal report of nonconformity serves as core evidence for financial chargebacks. It logs exact sample locations, ambient inspection conditions, and clear photos of every failed piece. Without that documentation, factories can argue testing was biased or conducted under poor lighting.
Third-party auditors attach calibration logs for calipers, scales, and moisture meters to prove measurement accuracy. The limit establishes the baseline; the report records what was actually found.
- Specifying acceptance quality limit terms in section four of the master agreement prevents disputes during high-volume production runs.
- Any acceptance quality limit adjustments must be formally initialed by both sides if material shortages require temporary revisions to secondary finishes.
- Listing acceptance quality limit figures on a bill of lading adds little legal value, as that document governs shipping liability rather than production tolerances.
Standards like ISO 2859-1 contain explicit switching rules that adjust inspection levels based on historical results. If a factory fails two out of five consecutive shipments, contracts typically mandate a shift to tightened inspection. That change goes out as a formal quality alert from the compliance team.
The protocol passes the added cost of larger sample sizes back to the manufacturer until failure rates drop back within tolerance.
The signed inspection report stays in the shipping dossier as the primary tool for settling disputes between buyer and seller.
A complete quality manual defines the exact instruments and steps required for every check under the plan. When measuring umbrella rib tension, for instance, procedure dictates whether to use a spring scale or a digital force gauge. Without standardized test methods, defect counts cause endless arguments rather than clear findings.
Tying invoice payments to a verified PASS report gives factories a direct financial incentive to control defect rates.
Standard contract clauses allow buyers to cancel orders and recover deposits if a supplier fails three consecutive inspection rounds.

Ledger
Exceeding defect limits creates immediate friction when a failed report reaches accounting. A rejected shipment generates fees for container storage, warehouse space, and sorting labor. When an AQL limit is breached, the buyer issues a debit note to charge back re-inspection costs and delay penalties.
Suppliers with recurring failures face margin haircuts or total replacement. Over time, financial statements show that poor manufacturing quality is remarkably expensive.
Consider the numbers on a rejected shipment of solar garden lights. On 15,000 units priced at $2.20 each ($33,000 total), a 2.5 major defect limit allows up to 14 failures in a 315-unit sample. Finding 22 defects forces the factory to unpack and inspect all 15,000 items individually.
At $0.15 per unit for sorting and repacking, the supplier absorbs a $2,250 internal loss before replacing broken components. The statistical cutoff acts as a real financial trigger.
- Failing an acceptance quality limit allows procurement to file a recovery claim covering re-inspection costs and demurrage charges.
- Steady acceptance quality limit results help meet annual cost reduction targets by cutting the frequency of third-party audits.
- Repeated acceptance quality limit failures can place a supplier on a probation period, threatening their access to trade credit.
- Catching acceptance quality limit breaches after arrival forces inventory managers to estimate a salvage value, often recovering under thirty cents on the dollar.
Enforcing a chargeback policy requires tight, unambiguous quality thresholds. In consumer electronics, a defect jump from three to five percent at retail wipes out net margins. A 1.5 acceptance limit provides a buffer against latent failures that develop during transit.
Stopping defective goods before export protects margin that would otherwise dissolve into return freight and restocking fees.
Protecting unit economics relies on holding the line where acceptable variance becomes financial liability.
Cargo underwriters frequently ask for documented AQL protocols before quoting competitive rates on marine cargo policies. Unverified shipments carry higher risk profiles because high defect rates increase port abandonment. Standardized inspection records show operational control, helping secure lower premiums.
The line between a Level II pass and fail marks the exact capital at risk in a transaction.
Tracking defect costs across textile shipments shows that early inspection reduced annual inventory write-offs by twenty-four percent.

Stock
Reliable inventory supply rests on the margin between factory defect rates and agreed inspection cutoffs. An importer facing empty shelves cares less about statistical theory than product availability. Excessively tight limits backfire when they disrupt distribution over minor cosmetic flaws buyers never notice.
Setting sensible targets balances finished quality against keeping product on retail shelves.
Moving goods efficiently from assembly to available stock is the true goal of supply chain quality control. When a factory runs at a 0.8 percent defect rate against a 1.5 percent limit, buyers allocate stock and run promotions with confidence. Predictable quality supports lean replenishment cycles and higher turnover.
Suppliers riding right on the cutoff force importers to maintain extra safety stock against failed shipments and sorting delays, tying up cash in warehouse buffers.
Auditors check crate conditions first as an indicator of plant discipline. Crushed or damp master cartons signal internal damage long before opening individual boxes. Poor exterior packaging prompts inspectors to increase scrutiny before pulling their first sample.
Clean, well-wrapped pallets suggest process control, whereas damaged packaging usually points to sloppy handling on the floor.
| Strategy | Level Selection | Impact on Stock Velocity | Secondary Verification Cost |
|---|---|---|---|
| High Speed | Level I | Maximizes throughput but increases field failure risk | Low origin cost / high warranty cost |
| Balanced | Level II | Normal operations for established supply chains | Medium cost shared in contract |
| Risk Mitigation | Level III | Slower replenishment; high early rejection probability | Highest origin cost / low defect slippage |
Inspection strategies balance statistical thoroughness against time to market. A Level III review takes longer and catches minor faults, keeping questionable stock off shelves, but adds days to lead times. Procurement teams adjust sampling rigor seasonally, tightening checks before holiday peaks to avoid high-volume returns or public complaints.
Applied properly, quality limits protect both inventory flow and brand standing.
A lot that barely passes contains the maximum number of faults allowed before cash starts moving backward.
Once cargo clears origin, inspection reports provide a baseline of expectation for receiving teams at destination warehouses. If a distribution manager opens five boxes and finds three damaged units, comparing those findings against the origin report ~ which showed only one defect in a 200-piece sample ~ helps determine whether damage happened in transit or during initial production. That record isolates root causes without assuming factory fault.
Does the inspection plan account for seasonal shifts in factory humidity?