Sampling Table
Meaning ~ A sampling table is a structured lookup chart used in quality control to find the required sample size and defect thresholds for accepting or rejecting a lot.

Origin
Statistical Foundations and Standards
Published within quality control frameworks like ISO 2859-1 and ANSI/ASQ Z1.4, a sampling table is a statistical lookup matrix used to determine how many product units must be inspected from a given lot size and set the thresholds for accepting or rejecting the entire lot based on nonconforming units. As the primary tool for acceptance sampling by attributes, it balances statistical risk for both purchaser and manufacturer. These tables descended from military standards used for ammunition inspection during mid-century manufacturing surges, later adapting to civilian trade with minor shifts in terminology.
They apply specifically to attributes ~ where items are classified simply as conforming or nonconforming ~ rather than continuous variable measurements.
By fixing these thresholds, standardized charts give both sides mathematically predictable transaction risks. Once a buyer agrees to a specific plan, the producer knows the exact probability of lot acceptance for any given defect rate. However, sampling assumes a homogeneous lot of discrete, finished units, so its applicability ends where continuous process monitoring or hundred-percent screening takes over.
Standard purchase orders often cite ANSI/ASQ Z1.4 to establish this statistical basis, which makes verbal agreements on defect rates contractually irrelevant.

Crate
Batch Isolation and Shipment Grouping
Before running a lookup, the factory floor isolates the full production run into a single, identifiable batch. This physical separation prevents mixing units from different shifts or tooling setups, which would skew the sample’s statistical validity. If pallets are stacked before all pieces are finished, an inspector cannot verify whether the sample is genuinely representative.
Likewise, a batch made from multiple raw material lots must be split into separate sub-batches, each evaluated on its own.
Draw samples only after the entire production run resides in finished cartons on the factory floor.
The inspectable unit depends on the package configuration, so a single item or an entire packaged set can count as one unit. Warehouse managers must arrange cartons so every pallet in the shipment is accessible, providing the physical layout necessary for a valid statistical evaluation.
- Sampling Table rules govern how units are drawn across different cartons, ensuring every finished piece stands an equal chance of selection.
- Sampling Table metrics define the boundary between a minor blemish and a major nonconformity, preventing arbitrary rejection.
- Sampling Table enforcement requires the manufacturer to present the entire batch before evaluation starts, preventing the selective presentation of pre-screened goods.


Bench

Randomization and Defect Classification
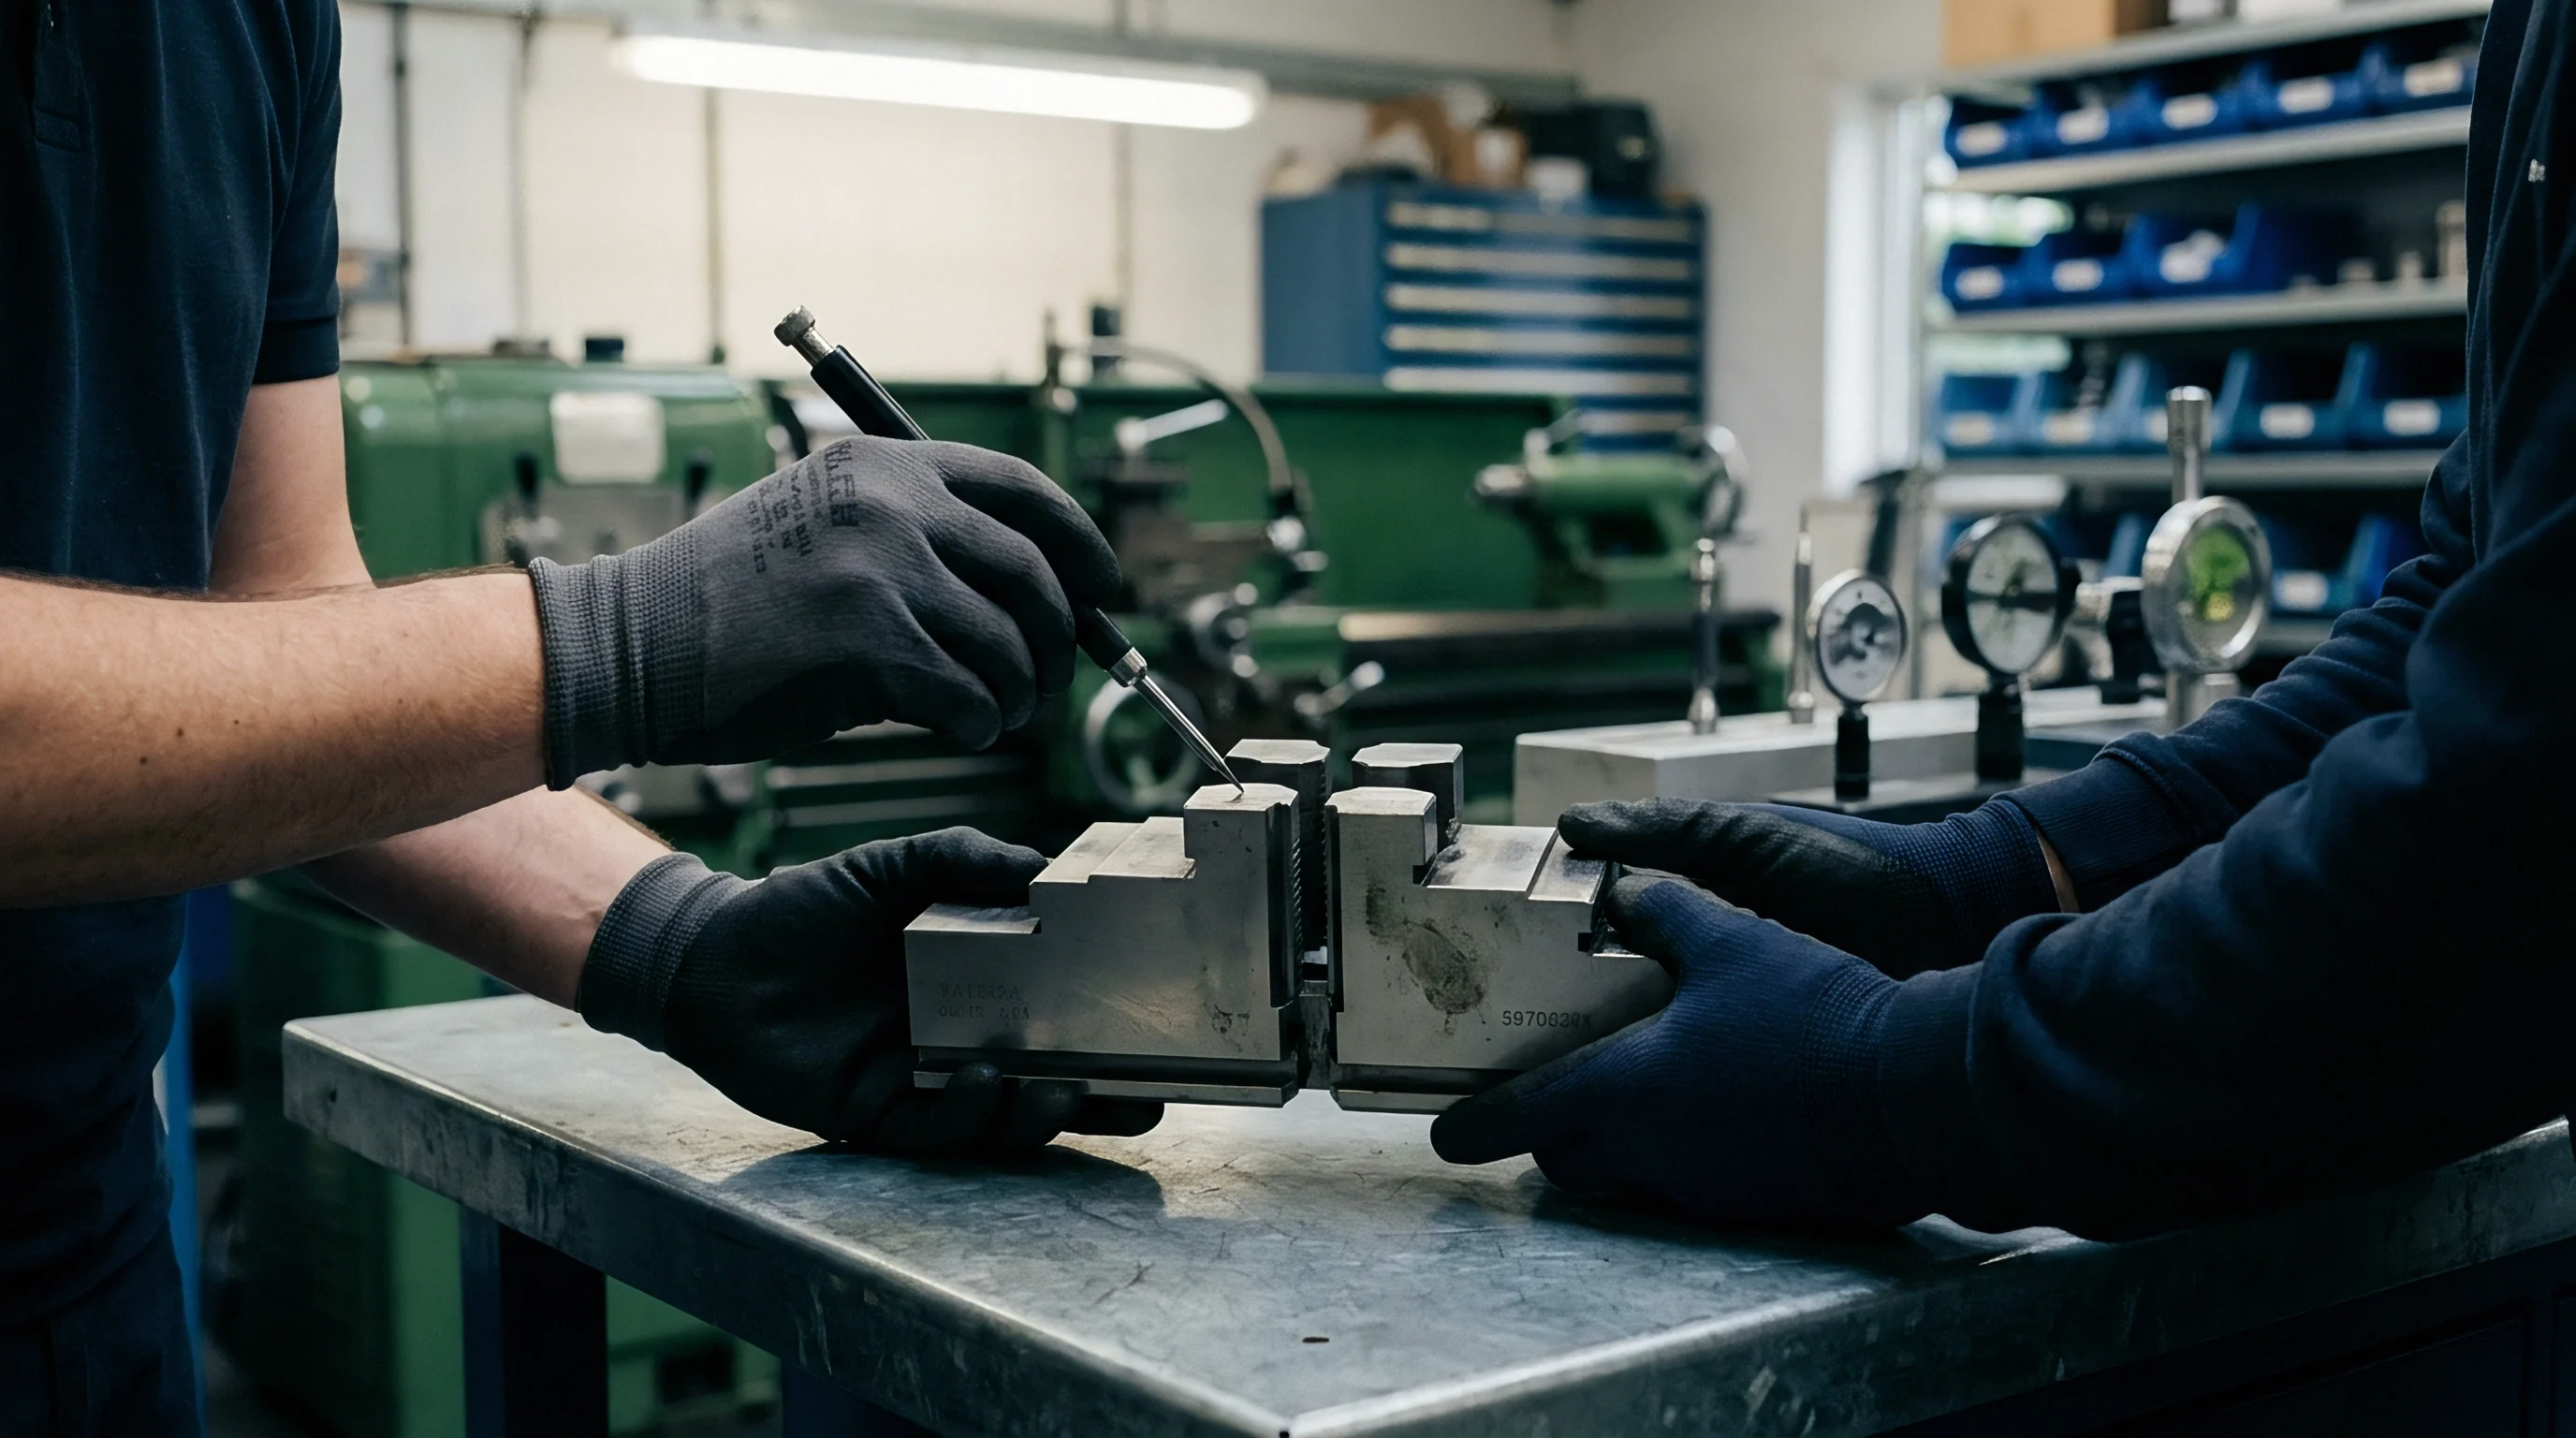
Physical inspection takes place at a dedicated workbench on the factory floor, where the inspector pulls units using random number lists or systematic sampling across accessible cartons ~ such as selecting every tenth box. Each unit is checked against an agreed inspection sheet that lists potential failure modes grouped into critical, major, and minor bands, each with its own threshold limit.
| Defect Class | Maximum Tolerated Defect Rate | Inspection Mode | Typical Test Method |
|---|---|---|---|
| Critical | 0.065% | Non-destructive safety test | Dimensional check of closure diameter |
| Major | 1.5% | Functional performance trial | Drop test of loaded carton |
| Minor | 4.0% | Visual evaluation on bench | Ink smear and color mismatch check |
The inspector checks physical properties with calibrated tools and logs every nonconformance on the reporting sheet. If a single unit presents both minor flaws and a major flaw, it is categorized strictly by its most severe defect for the threshold lookup. Failing to classify defects correctly before referencing the table undermines the whole statistical model.
Failing to establish clear visual criteria before reaching the bench causes endless disputes over borderline cosmetic defects, leading to delayed shipments and unrecoverable demurrage charges.

Arithmetic

The Double Lookup Process
Finding the sample size and decision thresholds requires a two-step lookup that links lot size to acceptable quality limits. First, the inspector finds the batch size range on the primary chart to obtain a sample size code letter, which specifies how many units to draw. Next, on the second chart, the intersection of that code letter’s row and the targeted quality percentage gives the precise acceptance and rejection numbers for the lot.
| Lot Size in Units | Level I | Level II (Default) | Level III |
|---|---|---|---|
| 151 to 280 | E | G | H |
| 281 to 500 | F | H | J |
| 501 to 1200 | G | J | K |
| 1201 to 3200 | H | K | L |
| 3201 to 10000 | J | L | M |
ANSI/ASQ Z1.4 Clause 9.4 dictates that the next larger sample size is utilized when a direct intersection points to an arrow.
A downward arrow directs the inspector to follow the column down until an accept-reject pair appears, adopting that new row’s sample size. An upward arrow requires a similar move upward, adjusting the sample volume to meet the stricter statistical demands of a lower defect target. The procedure follows four steps:
- Select the total lot size range from the far-left column of the matrix to set the baseline for the production batch.
- Cross-reference that row with the chosen general inspection level to find the single-character sample size code letter.
- Map the code letter to the secondary lookup matrix to get the designated sample size and accept-reject limits.
- Draw the physical sample units at random from across the lot to begin inspection.
When an arrow points to a larger sample size than the initial code letter, running the evaluation requires extra units that may exceed the inventory available on site.


Ledger

How Does a Buyer Trigger Stricter Evaluation?
Tracking quality across consecutive shipments activates switching rules that adjust inspection severity based on past performance. Importers start with normal inspection as the baseline so long as the supplier consistently delivers compliant batches. If production quality falters, shifting to tightened inspection increases the odds of catching subsequent failures ~ a step triggered when two out of five consecutive lots fail initial inspection.
An inspection of a five-thousand-unit lot at Level III demands eighty units instead of the standard thirty-two.
Returning to normal inspection requires five consecutive passing lots under tightened conditions, showing that the root cause of the defects has been addressed. Conversely, switching to reduced inspection becomes an option after ten consecutive batches pass without exception. Logging these transitions in a central ledger keeps the sampling plan responsive to ongoing shop-floor results.
- Sampling Table switching rules automatically adjust inspection severity based on a plant’s performance history across consecutive shipments.
- Sampling Table transition thresholds require five consecutive compliant lots under normal inspection before moving to a reduced inspection schedule.
- Sampling Table tightened inspection increases statistical protection by keeping or expanding sample sizes while tightening acceptable defect counts.
Who absorbs additional laboratory costs when a supplier remains stuck under tightened inspection for months often remains a point of contention.

Loss

Rework Cost and Reinspection Math
Rejecting a lot triggers immediate financial and operational costs across the supply chain. Consider a production lot of three thousand custom-molded plastic enclosures. Under standard lookup rules, evaluating this lot size at General Inspection Level II points to code letter K, requiring a sample size of one hundred twenty-five units.
If the contract specifies a major defect limit of one percent, the lookup sets an acceptance threshold of three units and a rejection limit at four.
If an inspector discovers five units with major structural cracks in the sample, the entire lot is rejected. The supplier must then isolate, sort, and reprocess all remaining units. Rework on this scale demands heavy labor and causes shipping delays that disrupt the buyer’s downstream distribution schedule.
| Expense Line Item | Responsible Party | Calculation Baseline | Total Estimated Cost |
|---|---|---|---|
| Factory Rework Labor | Supplier | 3,000 units at ten minutes each and fifteen dollars per hour | $7,500 |
| Scrap and Replacements | Supplier | 60 defective units at eight dollars material cost | $480 |
| Third-Party Re-inspection Fee | Supplier | Fixed-rate day charge and travel expenses | $650 |
| Airfreight Expediting Premium | Shared | Expediting one thousand units to bypass ocean delays | $4,500 |
A single failed inspection shifts substantial money from supplier margin to scrap and labor. Direct failure costs in this example exceed thirteen thousand dollars ~ easily wiping out the original profit margin on the batch. Once these costs are tallied, the buyer issues a debit note against the open letter of credit balance to settle the claim.