Sampling Plan
Meaning ~ A contractual protocol establishing sample sizes and defect thresholds used to determine whether a production lot is accepted or rejected during inspection.


Paperwork

The Contractual Placement of the Protocol
Contractual quality control relies on structured statistical protocols to set sample sizes for a production lot and define maximum defect thresholds for accepting or rejecting the entire batch.
Organized as a sampling plan, these mechanisms set the boundary between normal manufacturing variance and actionable non-conformance. When negotiating a supply contract, embedding this protocol directly into the master quality agreement heads off disputes over cargo acceptability. To be legally enforceable against the manufacturer, the purchase order drafted by the buyer must reference the specific sampling plan; stating that goods must be high quality provides zero protection in a cross-border dispute.
The chosen statistical protocol dictates the scope of testing before cargo passes the ship rail or leaves the factory gate. It governs pre-shipment inspection, turning subjective quality expectations into clear pass-fail contractual outcomes. If the lot passes, the supplier can submit the invoice under the letter of credit; if it fails, they must hold the shipment and absorb the costs of corrective action.
This risk allocation is the primary barrier against defective inventory entering the supply chain. The contract has to specify who holds custody of the cargo during inspection and set a firm deadline for submitting the report to the bank or freight forwarder.
A sampling plan applies only to a single, defined lot or production run; on its own, it cannot evaluate a manufacturing line’s long-term process capability. For that reason, the quality agreement must specify lot size, packing conditions, and the inspection site. If a lot is split into multiple shipments, each consignment requires separate evaluation under the protocol.
This keeps the buyer from accepting a mixed lot based on a sample drawn from an earlier run. Every production lot stands alone under the contract.

The Integration of Technical Standards
Most industrial contracts rely on established international standards rather than custom statistical models, usually referencing ISO 2859-1 or ANSI/ASQ Z1.4. These standards define standard operating procedures for attribute-based testing and supply the tables linking lot size to sample size. The buyer sets the acceptable quality limit based on commercial defect tolerances for that specific product category.
This limit is a contractual threshold rather than a guarantee of zero defects, defining the worst process average a buyer will accept over consecutive batches.
A complete quality clause must specify the governing standard, the inspection level, and the acceptable quality limit for each defect category. Without all three, a contract leaves room for the supplier to dispute inspection results on the grounds that the sample was too large or the threshold too strict. Defining these parameters up front binds the supplier to a clear evaluation method that holds up in legal proceedings, encouraging consistent process controls during production and reducing the risk of non-conforming shipments.
The sampling plan sets the boundaries of supplier liability during the pre-shipment phase, though it does not relieve them of basic obligations to deliver conforming goods under statutory sales law. Passing pre-shipment inspection, however, shifts the burden of proof to the buyer once the goods are accepted. That shift makes pre-shipment testing the single most critical checkpoint in quality control ~ it occurs when buyer leverage is at its peak, before cargo moves and payment is released.
The protocol is simply the tool that enforces that leverage.
- sampling plan sets the required sample size along with the exact acceptance and rejection thresholds.
- sampling plan sits inside the quality agreement as the binding rule for accepting or rejecting a lot.
- sampling plan prevents the buyer from taking delivery of batches with unacceptably high defect rates.
- sampling plan dictates whether the supplier is liable for re-sorting and rework expenses.
An explicit clause on this procedure alters supplier accountability, establishing that any lot failing pre-shipment inspection is rejected outright, without the option for the supplier to manually sort through defects at the buyer’s expense.


Bench

The Categorization of Product Anomalies
Before statistical tables can determine the fate of a manufacturing lot, finished items must be sorted into distinct defect severity levels.
On the factory floor, inspectors group non-conformances into critical, major, and minor categories. This isn’t just administrative bookkeeping ~ it dictates the sampling plan by assigning distinct acceptable quality limits to each severity class. Critical defects involve safety risks or regulatory violations, so buyers set a zero-acceptance threshold or an extremely low limit like 0.065 percent.
Finding even one critical defect fails the entire lot. The inspector logs the data, keeping categorization unambiguous.
Major defects impair product functionality or significantly reduce usability. In an optical transceiver, that might mean failing to transmit at the specified gigabit rate; in a metal casting, it could be a dimensional offset that prevents proper fit in an assembly housing. The acceptable quality limit for major defects usually rests at 1.0 or 2.5 percent, balancing performance demands against mass-production realities.
The sampling plan then assigns sample sizes and acceptance numbers to ensure the buyer does not receive a lot exceeding that defect rate.
Minor defects are purely cosmetic flaws that leave basic product function intact, such as light surface scratches, slight color shifts, or smudged packaging. Because of this, their acceptable quality limit is usually set higher, around 4.0 or 6.5 percent. They may harm shelf appeal without ruining the item, so the sampling plan permits a higher defect count before rejecting the lot.
Concentrating testing resources on high-severity issues keeps the quality control process commercially practical.

The Execution of Measurement Protocols
Physical measurement takes place at an inspection bench equipped with calibrated instruments. Using calipers, thread gauges, spectrometers, and pin gauges, the inspector checks dimensions and material properties against engineering drawings. Every check must follow a written test protocol; uncalibrated equipment or flawed techniques invalidate defect calls and make rejections easy for suppliers to contest.
To head off disputes, buyers should specify exact testing methods and required tools directly in the quality agreement.
Environmental conditions at the bench directly affect measurement accuracy. Good lighting, stable ambient temperatures, and a clean workspace are required to spot fine surface defects or take precise measurements. When checking custom metal castings, for instance, the inspector must let parts settle to room temperature before applying micrometers; measuring hot metal produces false dimensional readings from thermal expansion.
This level of bench discipline gives the inspection report credibility, guaranteeing the sampling plan operates on accurate, repeatable data.
Surface finishes and fiber alignment are tested before sealing the optical housing.
Every defect spotted on the bench must be photographed in high resolution and recorded on the inspection sheet alongside the item number, carton origin, defect description, and severity class. The supplier’s representative needs to witness the testing and sign off on the log. That signature stops suppliers from claiming defects were fabricated or occurred post-inspection, producing an undisputed record of the lot’s physical condition.
Cosmetic scratches frequently arise as an inevitable byproduct of manual handling without altering the functional performance of the device.


Arithmetic

Lot Size Limits and Code Letters
Standard lookup tables link total batch size directly to the required sample size.
The tables assign a sample size code letter from A through R based on batch volume. That letter determines the actual sample size and the corresponding acceptance or rejection thresholds. General Inspection Level II serves as the standard benchmark for consumer and industrial goods.
If a buyer trusts a supplier’s track record, dropping to Level I reduces sample counts and testing costs. Conversely, a new or unreliable vendor triggers Level III, boosting sample sizes to tighten statistical scrutiny.
The code letter points to a specific row on the single sampling plan master table, specifying sample size (n) along with acceptance (Ac) and rejection (Re) thresholds for each quality limit. A defect count at or below Ac passes the lot, while a count at or above Re fails it. Built on binomial and Poisson distributions, these ratios guarantee that the protocol hits target probabilities of acceptance for given defect rates.
The table below illustrates the lot size ranges and their corresponding code letters under the three general inspection levels.
| Lot Size Range | Level I | Level II | Level III |
|---|---|---|---|
| 151 to 280 | E | G | H |
| 281 to 500 | F | H | J |
| 501 to 1200 | G | J | K |
| 1201 to 3200 | H | K | L |
Looking at the standard tables, sample sizes grow alongside lot sizes to preserve statistical confidence, but they do so non-linearly. Under Level II, a lot of 500 units requires a sample of 50, whereas a lot of 5,000 units requires 200. This non-linear curve balances inspection expenses against statistical exposure, letting buyers maintain confidence in large batches without blowing through testing budgets.
The sampling plan is optimized for economic and statistical efficiency.

How Does Lot Size Affect the Sampling Plan?
Lot sizes directly dictate sample quantities and defect thresholds through the assigned code letter. Larger lots demand larger sample pulls to preserve statistical protection. The single normal sampling plan table below shows sample sizes and acceptance/rejection numbers for select code letters and acceptable quality limits, representing the exact defect counts allowed in a sample.
Buyers need to understand how these limits shift as lot sizes expand.
| Code Letter | Sample Size | AQL 1.0 (Ac/Re) | AQL 2.5 (Ac/Re) | AQL 4.0 (Ac/Re) |
|---|---|---|---|---|
| G | 32 | 1 / 2 | 2 / 3 | 3 / 4 |
| J | 80 | 2 / 3 | 5 / 6 | 7 / 8 |
| L | 200 | 5 / 6 | 10 / 11 | 14 / 15 |
| Methods: Ac represents the acceptance number, while Re represents the rejection number. Values derived from ISO 2859-1. | ||||
A lot size of ten thousand units under normal inspection level II requires a sample size of two hundred pieces.
An operating characteristic curve defines the probability of accepting a lot at any given defect rate, balancing producer risk against consumer risk. Producer risk is the probability of rejecting a good batch; consumer risk is the chance of accepting a bad one. A well-designed plan minimizes both by using a sample size that yields a steep curve, creating a sharp drop-off between high acceptance probability and decisive rejection.
That steep slope protects buyers from taking bad shipments and prevents suppliers from suffering unfair rejections.
Double sampling plans offer an alternative to single-sample evaluation. An inspector pulls a smaller initial sample; if quality is clearly high or overwhelmingly poor, a decision is reached right away. If defects fall into a gray middle zone, a second sample is drawn and evaluated alongside the first.
This approach can cut average sample sizes and labor costs during clean production runs, though it adds operational complexity on the factory floor. Buyers have to weigh that extra coordination against the labor savings.
Quality managers advise switching to tightened inspection whenever a line undergoes tooling repairs or transitions to a new raw material batch.


Crate

The Physical Logistics of Randomization
Physical sample selection requires absolute separation between factory staff and the boxes set aside for inspection.
The entire statistical protocol hinges on this separation. If factory workers pick the boxes, they naturally select pre-sorted stock or items produced under optimal conditions, making testing results meaningless. Instead, the inspector must walk the warehouse floor directly, using a random number generator and the packing list to select cartons.
Every pallet in the shipment must be accessible; if factory personnel block off certain rows, the inspector halts work until access is restored.
The process starts by checking total carton counts against the packing list and purchase order, ensuring the supplier hasn’t hidden suspect stock or split the lot without approval. Once numbers match, random selection begins. For instance, if a plan calls for 80 units out of a 5,000-unit lot packed across 100 boxes, the inspector pulls from at least 10 different cartons spread across top, middle, and bottom pallet layers.
That spatial distribution spots quality variations that occur over the course of a production run, making sure the sample genuinely reflects the whole batch.
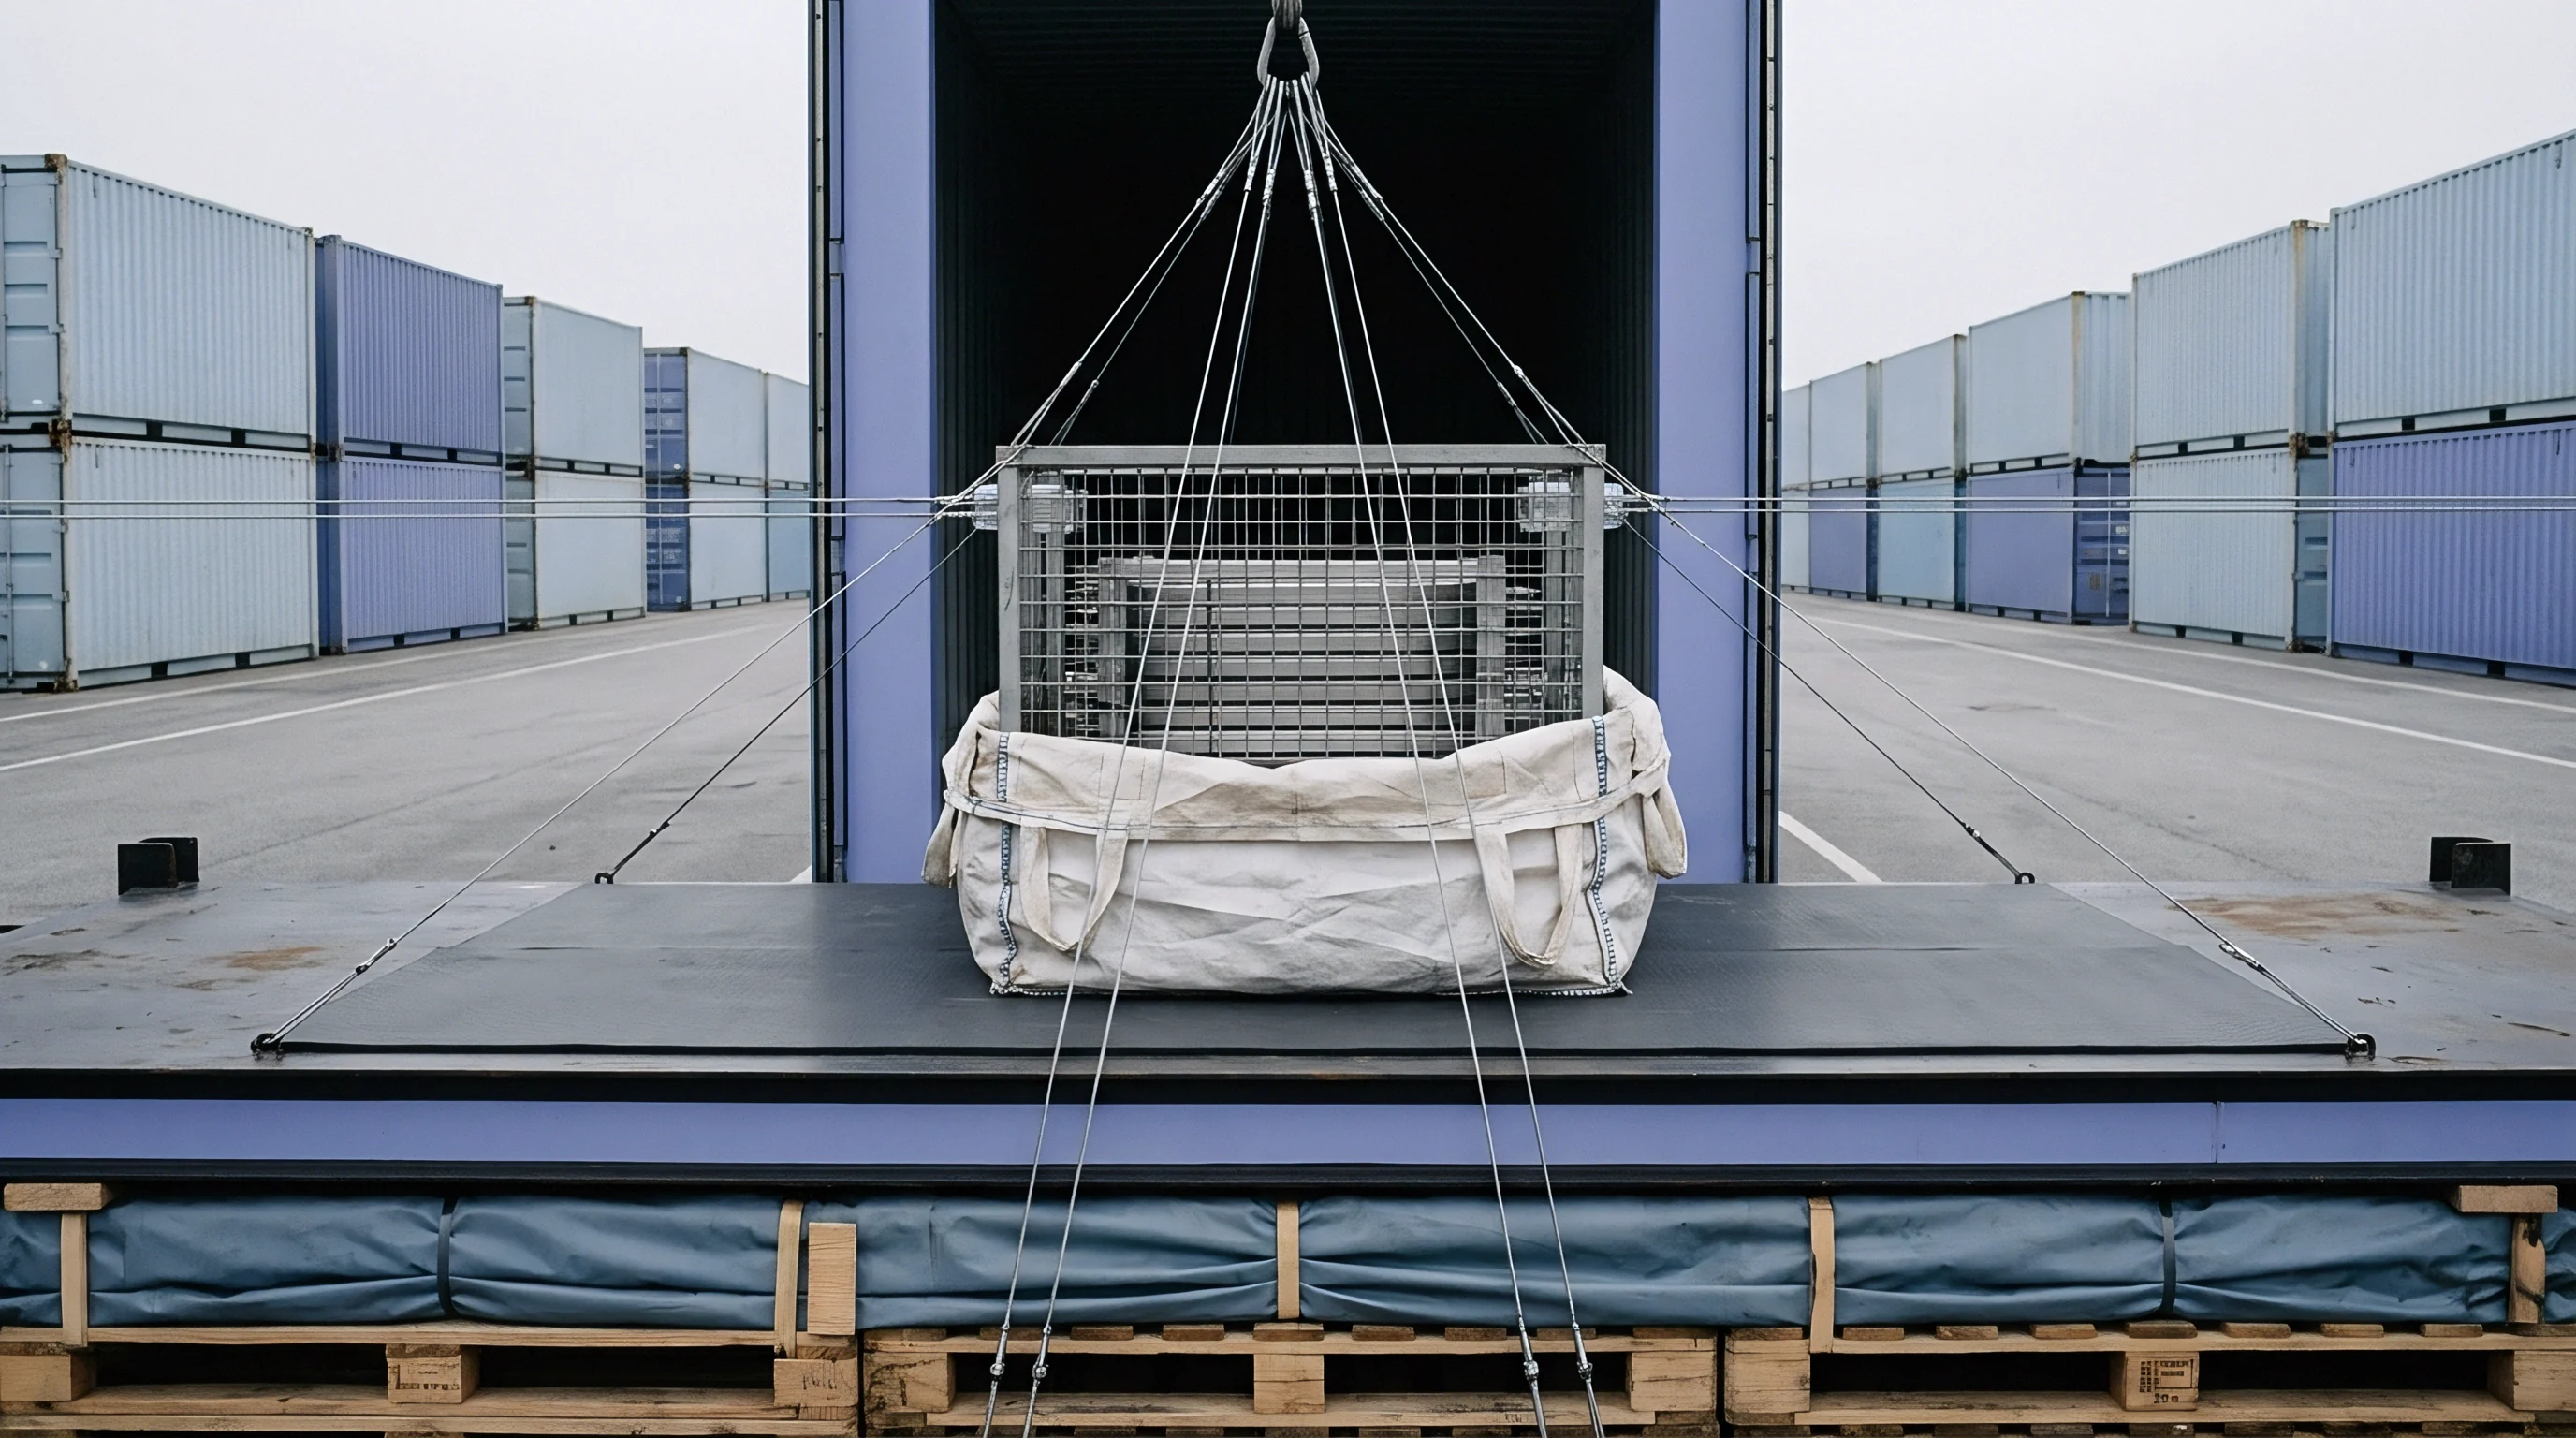
Pulling designated boxes takes physical effort: pallets must be broken down, opened, and unpacked. While factory workers provide the physical labor to move crates, the inspector must dictate exactly which boxes are pulled. Letting workers choose which cartons to fetch compromises randomization.
Once drawn, samples are tagged with unique identifiers and taken directly to the testing bench, stopping anyone from swapping in pre-tested parts. Chain of custody remains strictly with the inspector until evaluation ends.
The Extraction and Handling of Specimens
Unpacking individual units from selected boxes requires careful handling. For electronic or optical assemblies, inspectors wear anti-static wrist straps and cotton gloves to avoid static discharge or skin oil contamination. Heavy components like castings or machined parts require dedicated handling fixtures to prevent surface scuffs.
Units must be pulled from various depths inside each box ~ front, back, top, and bottom ~ so samples aren’t biased by surface rubbing or packaging damage along carton edges.
When testing is destructive ~ such as tensile testing on castings or stress testing high-power optical modules ~ drawn samples represent direct material losses. The sampling plan has to balance statistical confidence against the expense of destroyed inventory. Special inspection levels (S-1 through S-4) handle these situations by pulling very small samples, minimizing waste while retaining a baseline quality check.
Buyers need to explicitly cite these special levels in the agreement to avoid unexpected material expenses.
- sampling plan forces the physical breakdown of a lot into fully accessible sub-batches.
- sampling plan relies on a true random lottery where every unit holds an equal probability of selection.
- sampling plan requires inspectors to look past outer packaging layers and unpack the centers of stacked pallets.
- sampling plan loses all validity if the supplier chooses which boxes are inspected.
Failing to supervise random sample selection leads directly to accepting sub-standard lots that drive up warranty claims down the line.

Ledger

The Unit Economics of Lot Disposition
Financial exposure in international trade comes down to who holds the risk of defect discovery at the factory gate.
A failed pre-shipment inspection triggers immediate operational and financial fallout. Serving as a financial gatekeeper, the sampling plan dictates whether the buyer accepts cargo and releases payment or rejects the lot and demands rework. Standard financial audits track these exposures, where costs extend far beyond bad units to include re-inspection fees, sorting labor, demurrage charges, freight paid to the carrier, and downstream line downtime.
Contracts must explicitly hold suppliers liable for all costs tied to a failed lot, including third-party inspection fees for both the initial failure and subsequent re-tests, as well as warehousing and handling charges at the factory or origin port. Without these liabilities spelled out, suppliers lack financial motivation to maintain tight process controls. Putting these terms in the agreement shifts failure expenses back onto the factory, incentivizing them to run internal checks before calling in external inspectors.
The exposure table below illustrates the cost impact across three failure scenarios for a rejected batch of 5,000 custom castings valued at $15 per unit.
| Cost Category | Scenario A: Origin Rework ($) | Scenario B: Port Sorting ($) | Scenario C: Destination Return ($) |
|---|---|---|---|
| Labor and Operations | 3,500 | 12,500 | 75,000 |
| Freight and Logistics | 1,200 | 4,000 | 8,500 |
| Contractual Penalties | 0 | 0 | 15,000 |
| Total Exposure | 4,700 | 16,500 | 98,500 |
These figures highlight why finding quality failures prior to shipment is essential. Sorting goods at destination ports or shipping cargo back to the origin factory causes costs and lead times to escalate dramatically. In Scenario C, total losses surpass the original $75,000 value of the lot ~ a hit large enough to bankrupt smaller importers or wipe out margins on a major product launch.
The sampling plan serves as the primary shield against this risk, catching issues where corrective action is cheapest: on the factory floor before dispatch.

The Amortization of Quality Control Expenses
Importers need to weigh the total cost of ownership for their quality programs, factoring in routine inspection fees alongside the amortized expenses of failed batches. Third-party inspections generally run $300 to $600 per man-day depending on location and product complexity. When a plan calls for large sample volumes requiring multi-day audits, testing costs climb.
Buyers must weigh that outlay against the potential cost of product failure: for high-value or high-risk goods, several days of inspection cost a fraction of a potential batch loss, while low-margin, low-risk goods warrant simpler plans with reduced sample sizes.
To manage these costs efficiently, buyers can apply the switching rules built into standards like ISO 2859-1. These rules automatically shift inspection from normal to reduced levels after consecutive lots pass, and escalate from normal to tightened if a batch fails. Reduced inspection trims sample sizes and costs to reward consistent supplier quality, while tightened inspection scales up sample counts to protect buyers when factory controls wobble.
This dynamic adjustment concentrates quality budgets where risk is highest, providing a structured, data-driven approach to expense control.
- Calculate the direct labor costs required to perform a 100% sort of the rejected lot.
- Estimate the scrap value of non-conforming units against the cost of shipping them back to the factory.
- Formulate a debit note charging the supplier for re-inspection fees and production line downtime.
- Issue a formal corrective action request with a binding timeline for engineering resolution.
Purchase contracts containing a zero acceptance plan force the supplier to absorb the total cost of any batch exhibiting a single defect.
Establishing a pre-agreed fee schedule for third-party inspection services before signing the initial purchase order prevents late-stage financial disputes.


Dispute
The Mechanics of Conflict Resolution
A failed pre-shipment inspection creates instant friction between the buyer’s quality report and the factory’s yield targets.
When a report comes back with a failure, suppliers routinely contest the findings, claiming the inspector was overly harsh, the sample was not random, or the defects fall within acceptable commercial leeway. In one shipment of ten thousand optical transceivers, the inspector rejected the lot after finding six major defects in a sample of two hundred. Arguments then centered on whether damage occurred during production or from handling delicate optical interfaces during testing, which required reviewing video footage of the inspection to verify that static discharge protocols were followed.
This illustrates the friction between quality benchmarks and commercial deadlines.
Quality agreements need a clear, pre-defined process for resolving disputed results, typically requiring non-conforming samples to be sent to an independent accredited laboratory whose test results are legally binding on both sides. Contracts must explicitly assign testing fees to whichever party is proven wrong by the lab, which deters suppliers from lodging baseless challenges against inspector reports. That rule forces both sides to rely on objective data, preventing disputes from stalling shipments for weeks and straining business relationships.
Borderline defects ~ anomalies hovering near the boundary between major and minor, or dimensions riding the edge of tolerance limits ~ are another frequent source of conflict. Suppliers routinely push to classify these as minor to pass the lot. The inspector has to rely on the contract’s defect taxonomy and reference samples to make a call; if clear visual and functional benchmarks are missing, the decision is easily challenged.
Buyers should spend time assembling a comprehensive defect catalog with the supplier before production starts.

What Happens When a Batch Fails?
A failed sampling inspection halts shipment and triggers pre-agreed corrective measures. First, the buyer issues a formal Non-Conformance Report documenting defect types, locations, and inspection math. The supplier then submits a plan outlining how they will sort, rework, or replace non-conforming units across 100% of the lot ~ not just the initial sample pool.
Afterwards, the inspector returns for a re-inspection under a tightened sampling plan to confirm the rework succeeded. Enforcing each step is crucial to keep defective items out of the supply chain.
The financial impact of a failed batch extends beyond immediate rework costs to include missed market windows and breached delivery commitments. In seasonal retail or automotive manufacturing, even a few days’ delay can trigger steep penalties or cost a key account. Building delivery buffers into the supply chain schedule allows buyers to absorb the extra time needed for sorting and re-inspection without disappointing end customers.
While the sampling plan catches quality failures, schedule buffers manage the commercial risk that comes with them.
Disagreements over borderline defects are resolved by testing the disputed units on calibrated lab equipment.
Whether global supply networks can transition to automated, sensor-based tracking that makes manual attribute testing obsolete remains to be seen.