Terminal Automation ROI
Meaning ~ Metric evaluating the financial viability of autonomous equipment upgrades based on productivity gains against total acquisition and operating costs.
Arithmetic
Terminal automation ROI is the primary financial indicator for recovering capital invested in computerized port infrastructure and handling equipment. The calculation weighs initial spending on automated stacking cranes, autonomous horizontal transport systems, and integrated operating software against expected savings in labor, higher berth productivity, and fewer error claims. Stakeholders find the break-even point by tracking the shift from variable labor costs to fixed maintenance and amortization over a ten year to fifteen year horizon.
A typical model replaces traditional diesel, human-operated straddle carriers with electric automated vehicles, weighing power costs and software licensing against historic payroll and insurance premiums in high-accident manual zones. This metric stays strictly inside the terminal fence. It ignores downstream savings like faster truck queuing unless the terminal operator captures that value directly through gate fees or priority premiums.
Because throughput volume sits in the denominator, the final figure stays sensitive to shifts in container traffic.

Capital Expenditure Components
Initial deployment costs represent a heavy upfront hurdle. Manual facilities scale labor with volume, but automated terminals front-load expense into sensors, remote control stations, and high-density yard layouts. Prep work for the infrastructure alone often equals the price of the machinery.
Foundation requirements for an automated stacking crane (ASC) often outstrip those of traditional rubber tired gantry cranes; millimeter-perfect placement leaves no room for ground subsidence. That need for precision forces deeper piling and heavier concrete runways onto the balance sheet before the first container lands.
Software introduces a non-physical investment layer that behaves nothing like steel. Terminal operating systems (TOS) coordinating autonomous movements run on millions of lines of code and require months of on-site simulation. These costs amortize over the contract term, but vendor lock-in weakens the buyer’s hand during future upgrades.
Integrating a legacy gate system with a new OCR scanner suite added seven percent to the total budget and pushed the return date back eighteen months. Buyers quickly learn that while hardware depreciates, software carries renewal fees that never sunset.

Operational Expenditure Savings
Cutting direct operational spending forms the second pillar of the calculation. Labor is the biggest variable cost in traditional terminals, often sixty percent of daily running expenses. Automation shifts operations toward a maintenance-heavy model.
Manual facilities require multiple shifts of crane drivers, yard hustlers, and tally clerks; an automated setup relies on a much smaller crew of remote operators and technicians. The savings go beyond base wages, cutting out safety bonuses, mandatory breaks, and peak-season overtime.
Terminal automation ROI reaches positive territory when reduced variable labor costs exceed the rise in fixed annual maintenance and software licensing over a sustained five year period.
Energy efficiency also tilts the ledger. Electric horizontal transport systems use regenerative braking and route optimization that human drivers cannot replicate at scale. In one comparison between two Mediterranean transshipment hubs, the electric fleet consumed twenty two percent less energy per move than an equivalent diesel fleet.
That saving offers a clear hedge against fuel volatility, tying financial models to predictable utility rates instead of wild oil markets. Reliable energy savings help keep the math stable during trade lulls when volume-based profits drop.

Throughput Velocity Enhancements
How fast a terminal moves containers across the quay wall sets its revenue ceiling. Automated cranes work steadily around the clock, sidestepping the slowdowns that happen during shift changes or bad weather. Human drivers tire, and cycle times slip by the eighth hour of a shift.
Robots run the exact same seconds-per-move pace at midnight as they do at noon. That consistency lets operators tighten feeder vessel schedules and cut expensive berth wait times for deep-sea liners.
| Performance Factor | Manual Baseline | Automated Target | Observed Variance |
|---|---|---|---|
| Moves Per Hour Average | 24.5 | 28.2 | +15.1% |
| Maintenance Hours Per Year | 450 | 620 | -37.7% |
| Incident Rate Per 100k Moves | 1.2 | 0.15 | +87.5% |
| Operating Energy Cost Per TEU | 4.12 USD | 2.85 USD | +30.8% |
Bumping moves per hour by even a fraction adds up over thousands of cycles. For a mid-sized terminal handling eight hundred thousand TEUs a year, a three percent jump in crane productivity unlocks capacity for another twenty four thousand containers without adding an inch of land. That spreads fixed overhead across a wider revenue base.
In landlocked, urban ports where physical expansion is impossible, this latent capacity is usually what justifies the high upfront cost. Technology substitutes for real estate.
Sensors on automated guided vehicles failed early when salt air corroded protective housings faster than initial lab tests had predicted.
Verification
Measuring true performance gains takes a framework that isolates internal efficiency from market swings. Separating real technological returns from baseline demand growth is the hard part of a modern logistics audit. Auditors focus on cycle times under load rather than quarterly revenue totals.
Auditors use benchmarks like net quay crane moves per hour and average truck turn time to set baseline performance. That gives buyers a clear picture of whether equipment meets contract specifications before warranties expire.
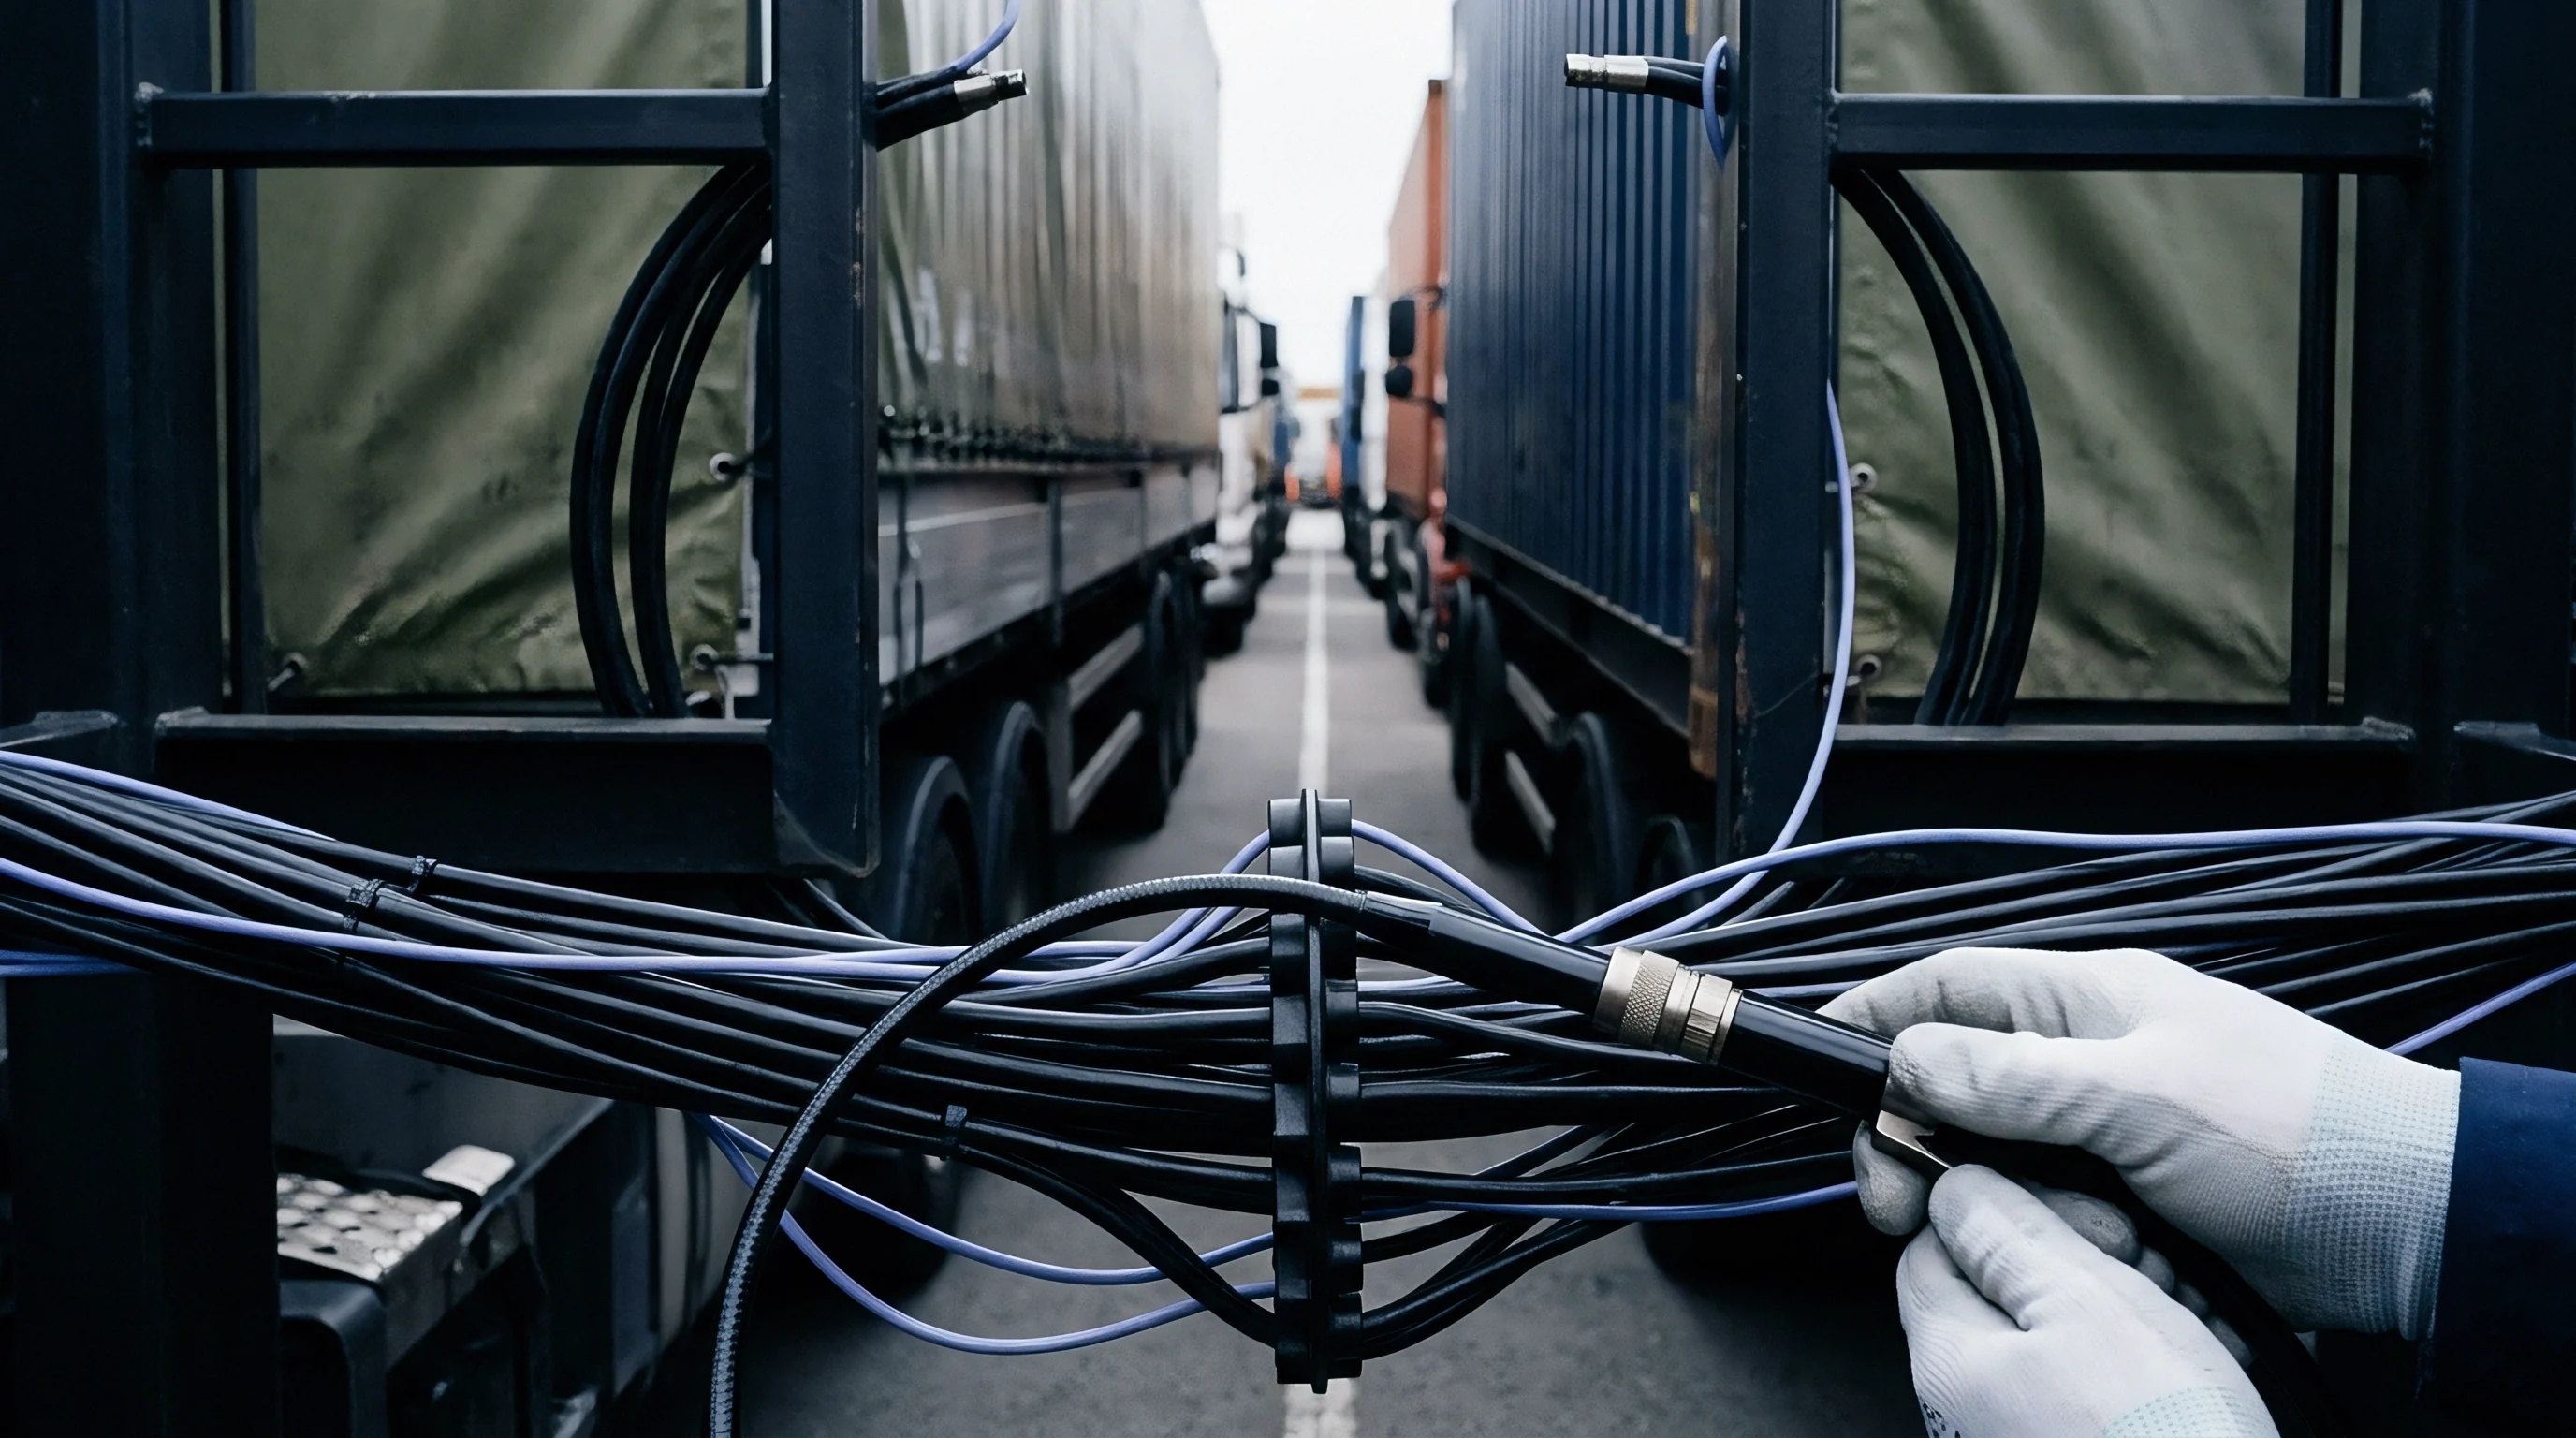
How Does Automation Impact Accuracy Standards?
Fewer data entry errors and misplaced containers yield direct savings that simple payroll comparisons miss. Manual yard checks depend on operators logging slot locations ~ a process vulnerable to transposed numbers and misplaced boxes. When a container vanishes inside a yard holding fifty thousand units, searching for it while delaying a vessel hits the operator directly.
Automation syncs physical locations with digital database records in real time. Verification plans look for a ninety nine point nine percent location accuracy rate, cutting double handling and keeping night-shift yard shuffles efficient.
Standard KPIs isolate automation metrics from weather delays or labor disputes. The primary audit point is the gap between planned moves and actual execution. High-performing systems show tight consistency, whereas poorly calibrated sensors produce jerky movements that accelerate wear.
Tracking motor current draw acts as a proxy for mechanical efficiency; sudden spikes signal physical resistance or flawed software logic triggering harsh acceleration and braking. These micro-level figures prove whether the investment holds up on an engineering level.
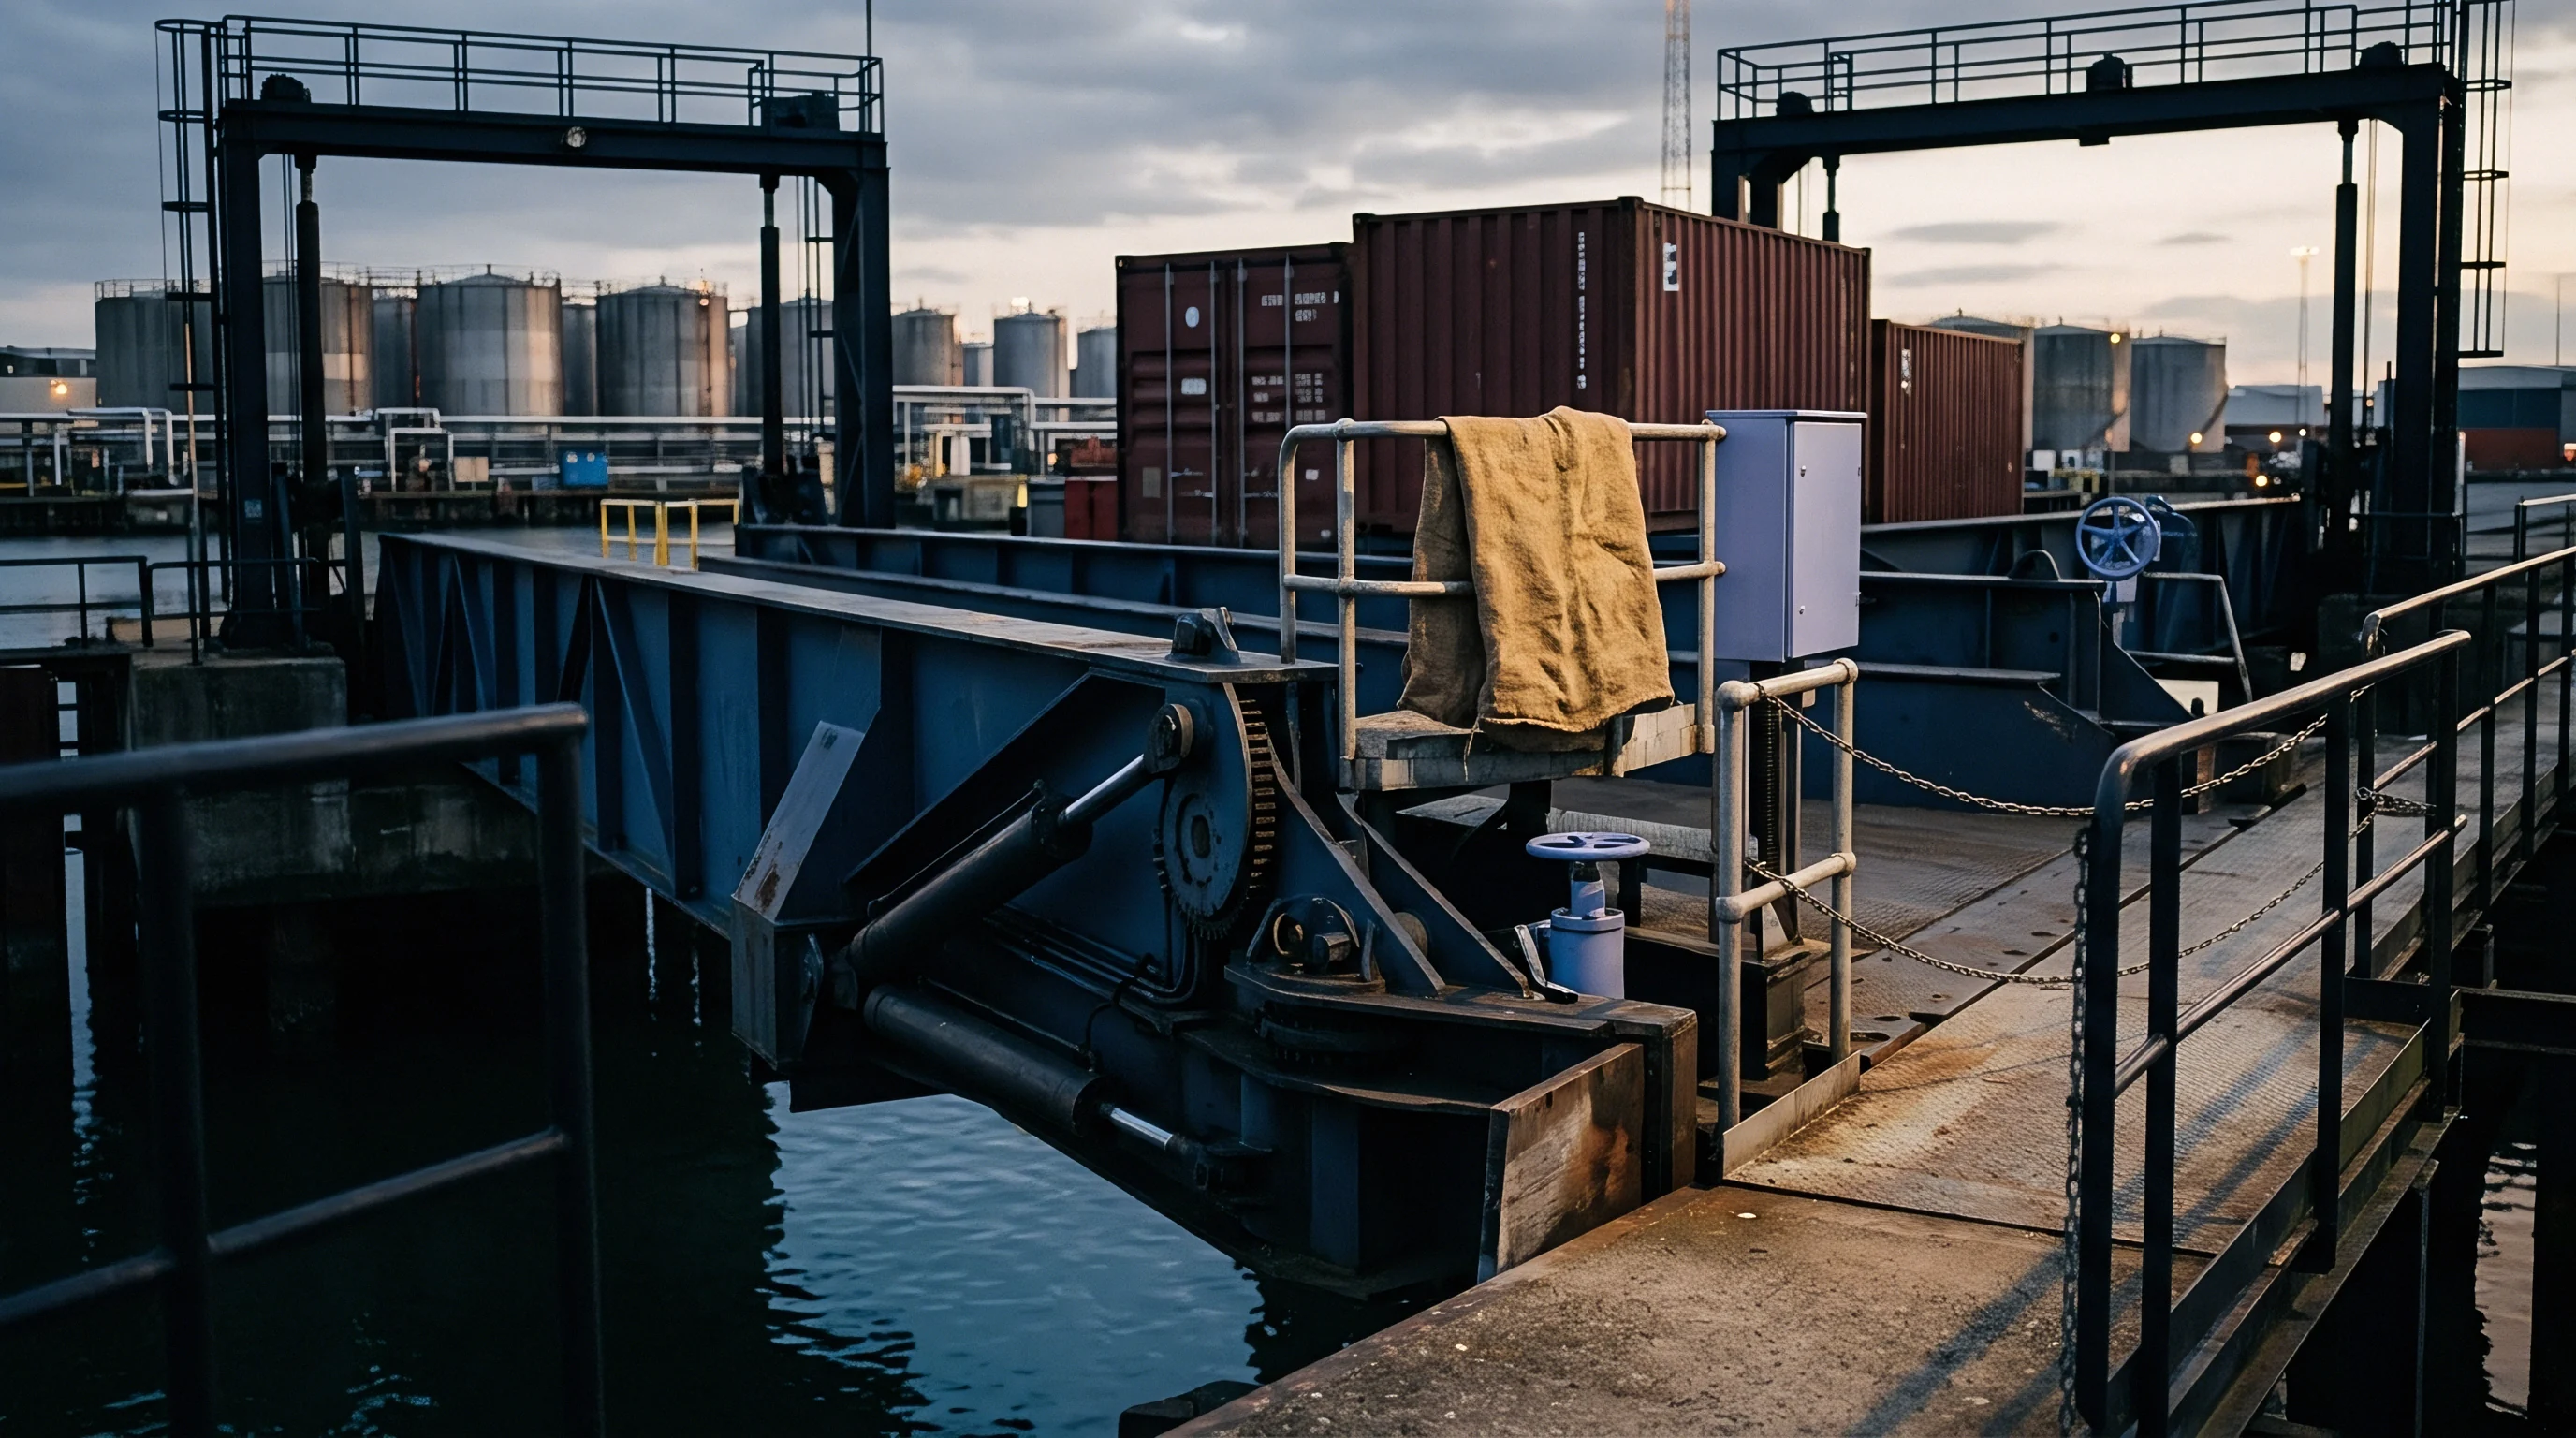
Audit Protocols for Systems
- Inspectors verify that automated stack configurations preserve box density without pushing average re-handles past negotiated limits.
- Sensor calibration reports are audited to confirm automated guided vehicles stay within twelve centimeters of proximity targets at operating speeds.
- Uptime logs are cross-referenced with maintenance records to distinguish planned preventive work from unexpected hardware or software failures.
- Gate throughput is checked during peak and off-peak periods to confirm OCR bottlenecks aren’t eating up quay-side productivity gains.
Verification also extends to safety. Conventional terminals pay steep insurance rates because crew and heavy machinery share tight spaces. Automated zones restrict access, cutting foot traffic and accidental collisions.
Lower insurance premiums give the ledger a clean boost, provided the facility maintains a zero-accident record over consecutive audit cycles. A single incident can halt operations for a full investigation ~ an expensive outcome that makes safety tracking central to long-term returns.
Verifying physical throughput requires cross-checking digital timestamps from the terminal operating system against video footage to ensure equipment stays active between jobs.
Field data shows that moving from manual to automated verification cuts quarterly inventory reconciliation from four days to six hours. Closing books faster lets finance teams manage reserves more tightly, freeing up capital previously set aside for missing-cargo claims. Auditors look hard at the raw data coming off the machines, making sure software isn’t smoothing over brief idle periods.
Honest verification requires data independent of the equipment manufacturer’s built-in reporting.
Which system components account for most downtime when sea-level humidity spikes?
Ledger
Accounting for modern terminal operations requires moving beyond basic cash-flow checks into complex amortization. Automated projects outlast the tenure of the managers who sign off on them, so the ledger turns into an ongoing record of initial strategy. Financial models track total cost of ownership by factoring in power upgrades, technician training, and back-up system redundancy.
If a manual yard stalls, operators hire extra drivers; if an automated terminal’s main server crashes, everything stops. Building in operational redundancies carries real costs that efficiency gains must absorb.

Comparative Operating Margins
Comparing margins between manual and automated facilities shows a distinct hockey-stick curve once systems mature. Debt service suppresses margins early on, burning through initial labor savings. But once volume crosses a key threshold ~ around six hundred thousand TEUs for a mid-sized port ~ the automated model pulls ahead fast.
Handling extra containers without adding labor means profits on those extra moves go straight to net income. That scale advantage drives global terminal operators looking to defend or expand market share.
A common rule of thumb: for every dollar cut from operator payroll, expect to add thirty cents in specialized technical maintenance.
Variable costs become far more predictable under automation. Monthly energy expenses can be forecast within three percent based on scheduled ship calls alone. Manual setups stay exposed to volatile factors like labor negotiations, healthcare costs, and local driver shortages.
That operational predictability appeals to institutional investors and bondholders looking for steady yields. Swapping variable labor risks for fixed capital costs can even lower the overall cost of capital for the port operator.
Sensitivity to Volume Shifts
A prolonged drop in trade poses the biggest risk to automation economics. With fixed costs locked in, a thirty percent fall in container volume hits an automated facility much harder than a manual competitor. Manual sites reduce shift hours and park straddle carriers.
An automated site carries fixed hardware debt and software licenses whether the yard is packed or bare. Operators calculate break-even levels carefully to see how far volumes can dip before operating at a loss. Automated terminals need roughly fifty five percent utilization to cover fixed overhead, compared to forty percent for lean manual operations.
| Capacity Utilization | Annual Revenue Delta | Net Margin (Manual) | Net Margin (Automated) |
|---|---|---|---|
| High Demand (90%) | +12% | 18% | 27% |
| Base Case (70%) | 0% | 14% | 16% |
| Market Downturn (50%) | -15% | 9% | -2% |
The swing in profitability comes down to cost structure: automated terminals can’t shed costs quickly in a downturn. They operate as a high-leverage play on global trade. When ships line up and quays stay busy, margins jump.
When the yard sits empty, equipment depreciation rolls on regardless. Strategic buyers stick to stable, multi-decade trade corridors to justify heavy fixed investments. Avoiding automation in volatile emerging markets subject to sudden geopolitical disruptions is standard practice.
Financial viability hinges on steady container flow through the gates.
Setting aside a dedicated reserve fund for five-year hardware refreshes stops terminals from building up tech debt, where legacy machines choke performance on newer software releases.
Friction
High-level automation introduces operational friction that delays expected returns. Resistance from staff, system compatibility issues, and aging wharf structures frequently slow progress. These function as friction points ~ expenses that burn budget without moving cargo faster.
The shift from manual operations to full autonomy poses the greatest financial risk. Operators end up carrying dual costs ~ paying existing labor while funding new systems during mandatory parallel testing. In complex brownfield facilities, this double overhead can stretch on for eighteen months.

Internal Resistance and Skill Gaps
Workforce transitions cause much of this operational friction. Veteran crane drivers hold an intuitive feel for wind and sway that software struggles to match early on. Concerns over job security can trigger labor disputes, halting site work or delaying system testing through strict work-to-rule tactics.
At the same time, existing port mechanics rarely have the specialized background needed to service autonomous equipment. Hiring outside engineers or funding extensive retraining programs adds millions before commissioning even starts. Technical retraining accounts for four percent of overall friction costs.
Integrating systems from different vendors creates another major bottleneck. Splitting orders between crane manufacturers and software vendors keeps pricing competitive, but getting distinct APIs to communicate smoothly in real time often stalls deployment. In one deployment, an API handshake failure between gate OCR systems and yard management software backed up trucks for four miles.
Hours spent debugging protocols mean machines sit idle, eroding project ROI by the day. Open standards are advancing, but proprietary software locks remain a common headache.
Physical Infrastructure Limits
- Terminal Automation ROI assumptions break down if wharf decks lack the structural load capacity for the dense, fast stacking arrays needed to make automation pay off.
- Terminal Automation ROI targets must be scaled back if local power grids cannot guarantee ninety nine point nine percent uptime for electric fleets.
- Terminal Automation ROI erodes when extreme ambient temperatures exceed the operating limits of proximity sensors on automated guided vehicles.
Ground preparation is frequently overlooked in project budgets. Automated stacking cranes operate on steel rails that require millimeter-level precision over hundreds of meters. On soft ground or reclaimed delta land, track stabilization alone can cost more than the cranes.
If rails settle unevenly, cranes lose positioning accuracy and force operators back onto manual control while crews complete costly repairs. Older ports modernizing their yards hit this barrier regularly. Ground stability dictates real-world ROI.
Contracts typically require equipment suppliers to pay liquidated damages if integration friction keeps berth productivity below twenty moves per hour after ninety days of live operations.
Truck drivers and shipping lines won’t tolerate gate delays caused by software glitches. If an automated gate moves slower than the manual terminal down the road, carriers divert volume to competitors. That lost volume drops off quickly and takes years to recover.
Systems must perform cleanly from day one to keep shipper confidence. Operational friction isn’t just an internal budget issue ~ it damages market reputation and caps earning potential. Navigating the transition demands realistic planning grounded in site conditions.
Service agreements strictly cap technical support response times for automated vehicles at two hours during peak berthing windows to prevent vessel delays.
Capital
Funding terminal automation takes careful structure across asset financing and vendor deals. Operators rarely buy these setups outright; they leverage future revenue streams to issue infrastructure bonds or secure equipment leases. Interest carried over a ten-year term can add twenty percent to total project costs, shifting the financial baseline.
Evaluating financing expense alongside operational metrics ensures operational savings aren’t simply swallowed by debt service. When interest rates are high, phased modular deployments make far more sense than single-stage overhauls.
Asset Lifecycle and Depreciation
Managing digital asset obsolescence has become essential in port accounting. A ship-to-shore crane steel frame lasts thirty years with routine maintenance, but its sensors and onboard processing hardware usually reach end-of-life in seven. A tiered depreciation model separates long-term physical structures from computing hardware.
Depreciating software over thirty years leaves operators financially unprepared when a ten million dollar tech refresh hits in year six. Accurate capital mapping treats recurring software and sensor updates as predictable fixed costs rather than unexpected capital shocks.
Resale value for specialized automated equipment is minimal. A manual forklift resells easily to industrial warehouses; an automated stacking crane running proprietary control code appeals to maybe ten terminals worldwide. That illiquidity increases lender risk.
In response, banks demand larger down payments and tighter repayment schedules than they require for conventional gear. That structures immediate performance pressure into the project, leaving zero margin for extended commissioning delays or slow operational ramp-ups.

Investment Strategy Comparison
A phased investment approach lets operators work out operational issues on a smaller scale before committing full capital. Contrast this with a total facility shutdown where systems are swapped out all at once. Big-bang conversions reach peak operational margins faster, but they carry severe operational risk if software or hardware glitches hit on launch day.
Phased rollouts maintain baseline cash flow from manual zones while testing automated blocks in isolated sections, using real operational data to refine financing for later phases.
| Year | Phased Capex (Millions) | Direct Capex (Millions) | Net Cash Flow (Phased) | Net Cash Flow (Direct) |
|---|---|---|---|---|
| 1 | 15 | 85 | +8 | -92 |
| 2 | 20 | 0 | +5 | -5 |
| 3 | 25 | 0 | +2 | +12 |
| 4 | 25 | 0 | +6 | +18 |
| 5 | 0 | 0 | +14 | +22 |
| 6 | 0 | 10 (refresh) | +18 | +15 |
While direct deployment accelerates net returns, its heavy year-one negative cash flow leaves the operator exposed if borrowing costs rise. Phasing trades rapid deployment for cash stability and strategic flexibility. It lets operators capture falling sensor costs or upgraded software versions when buying second and third equipment lots.
In a sector where technology evolves faster than heavy machinery can be built, that flexibility carries real financial value. Capital allocation remains the single highest-stakes choice in terminal automation.
Overall capital commitments rest on the assumption that major trade routes will not permanently bypass the port for deeper-water alternatives elsewhere.


Docks
Physical conditions at the quay wall dictate the operational limits of automated hardware. High-speed cranes need reliable ship-to-shore connectivity and heavy-duty fender systems to keep berthed ships motionless during handling. Even minor vessel surge throws off trolley positioning sensors, forcing remote operators to take manual control.
Evaluating quay structural integrity is critical; running high-precision cranes on a shifting wharf guarantees mechanical wear and downtime. The dock structure forms the baseline foundation required for automated equipment to reach target speeds.
Berth Utilization Metrics
Managing vessel arrival windows efficiently raises revenue per meter of quay wall. Automation tightly links vessel stowage plans to yard movement schedules. When crane software knows the exact unloading sequence for twenty incoming containers, it stages yard stacks hours ahead of time.
That eliminates the manual re-handling common when ships arrive out of order. A twelve percent bump in berth utilization serves as a standard baseline target. That delivers higher revenue from the existing dock footprint ~ the costliest real estate in the terminal network.
Moving operators from high crane cabins over the water to climate-controlled central control desks dramatically improves working conditions and extends driver careers. It also makes shift handovers virtually instantaneous. A driver logs off crane number four, and a colleague logs in from an adjacent desk without taking time to walk out to the quay.
Saving those minutes on every shift adds up to hundreds of additional container moves each year. Drivers remain essential, but physical transit time no longer throttles berth throughput.
Safety in Loading Zones
- Terminal Automation ROI guidelines require automated loading zones to be enclosed by infrared safety barriers that cut power immediately if personnel enter vehicle pathways.
- Terminal Automation ROI benefits include eliminating vehicle tip-overs resulting from driver error or miscalculated container weight distribution.
- Terminal Automation ROI models factor in lower damage claims on cargo, as computer-managed crane movements eliminate harsh starts and stops.
Despite software automation, ground crews must still manually pin and unlash containers on board. Combining automated crane moves with manual lashing creates an operational bottleneck. Tracking crane idle time shows where automated gear waits on lashing teams to clear work zones.
If unmanaged, expensive automated cranes sit idle, erasing speed gains achieved on the trolley run. Efficient operations deploy digital work queues that signal exactly which container bays are unlashed and safe for picking. Inter-crew coordination at the dock face decides whether throughput targets are met.
Underwater piling maintenance must be planned around crane servicing schedules so structural and seismic reinforcement work doesn’t disrupt peak holiday shipping volumes.

Clause
Rigorous contract terms provide the legal framework for multi-million-dollar automation commitments. Hardware sales agreements and software licenses must tie vendor payments directly to demonstrated operational benchmarks. Building performance triggers into supply contracts protects terminal operators from paying for equipment that falls short of technical specs.
Contracts usually require target moves per hour over a consecutive thirty-day acceptance trial. If equipment fails, final payment stays in escrow until problems are resolved. Tying vendor cash flow to operational targets remains the most effective way to limit tech implementation risk.

Liability and Integration Logic
Disputes erupt quickly when equipment from one manufacturer fails to sync with software from another. Encapsulation clauses specify exact responsibility hand-off points between vendors. For instance, the gate software vendor assumes responsibility for throughput up to the point where data transfers to the automated guided vehicle.
Clear contractual boundaries prevent vendors from shifting blame during system-wide outages. Designating a lead integrator contractually avoids years of litigation and identifies a single accountable party when systems break down. Paying for integration management is expensive, but it prevents unbounded legal liability.
Master services agreements require vendors to meet performance benchmarks consistently across varying workload levels before receiving final integration payments.
Liquidated damages for late delivery must mirror actual daily revenue lost by the terminal. If a key crane arrives three months late, damages should cover lost container moves and line penalties alongside capital costs. Calculating these figures conservatively ensures they stand up under judicial review, as courts routinely throw out punitive penalty clauses.
A balanced clause provides sufficient leverage to keep suppliers focused on deadlines without destroying vendor relationships. A well-written contract drives performance just as directly as physical machinery.

Service Level Agreement Dynamics
- Service level agreements mandate a fifteen-minute maximum response time for any software failure that stops crane activity.
- Vendor access clauses govern how external tech support monitors system data while remaining compliant with local privacy laws and port security regulations.
- Escrow clauses require terminal operating system source code to be held by an independent third party to safeguard operations if a software vendor becomes insolvent.
- Force majeure terms explicitly exclude routine software bugs and network outages within the vendor’s operational control.
Protecting project returns requires ensuring software updates never disrupt peak shipping periods. Blackout clauses restrict vendors from pushing non-essential updates during the three-month run-up to peak holiday surges. Unchecked software patches intended to fix minor bugs have crashed operational gate systems before.
The right to delay or reject an update is just as critical as the right to request one. Control over deployment timing must remain with the operator carrying the financial risk.
Section 14.2 of the standard terminal agreement mandates that all software updates undergo testing in an offline simulation environment before rollout to the live operating fleet.