Producer Risk
Meaning ~ Statistical probability of rejecting a production lot that actually meets the mutually agreed acceptable quality limit is known as producer risk.


Curve
Producer risk in cross-border manufacturing contracts is simply the statistical probability that a lot meeting the agreed acceptable quality limit gets rejected anyway. On the factory floor, this number acts as a governor on operations, dictating how frequently a supplier turning out acceptable work is penalized because of sample variance. It is built into standard sampling tables of agreements referencing ISO 2859-1 or ANSI/ASQ Z1.4, defining the odds of a Type I error (alpha risk) where good material is marked defective.
That probability only drops away under one hundred percent inspection, where sampling theory yields to an absolute defect count. For importers managing steady production runs, this margin for error is pure operational friction, driving up freight waste and souring vendor relationships.
Operating Characteristic Dynamics
The Operating Characteristic curve is the core mechanism of any attribute sampling plan, mapping the actual defect rate of a batch against the odds that the plan accepts it. When a line runs well inside the acceptable quality limit, the acceptance probability should sit near one hundred percent. Even so, random draws mean an inspector will occasionally pull an unrepresentative pocket of flawed units from an otherwise good lot, triggering an unjustified rejection.
The curve’s height at the acceptable quality limit marks the exact likelihood of that outcome, where even a single-digit change in the acceptance number can double false rejections on compliant lots.
Controlling this exposure comes down to tuning sample size and acceptance thresholds. Skimping on sample size flattens the curve, letting bad lots through while bouncing good ones. Increasing sample size steepens the slope to separate good batches from bad more cleanly, though it demands more bench hours and destructive testing.
Balancing those demands is the central compromise of quality planning, as illustrated by baseline dynamics for a standard single sampling plan for attributes under a Poisson model.
| Lot Defect Rate (Percent) | Probability of Lot Acceptance (Percent) | Probability of Lot Rejection (Percent) | Statistical Risk Classification |
|---|---|---|---|
| 0.5 | 99.2 | 0.8 | Acceptable Quality |
| 1.0 | 95.3 | 4.7 | Producer Risk Threshold |
| 2.0 | 78.4 | 21.6 | Intermediate Variance |
| 5.0 | 23.0 | 77.0 | Consumer Risk Zone |
| Calculations utilize the Poisson distribution to model attribute nonconformities in large batches. | |||

Statistical Assumptions and Process Averages
These risk calculations assume a steady-state line and homogeneous batches. If tooling wears out unevenly or the process drifts mid-shift, defects stop distributing randomly, breaking the underlying Poisson or binomial math. Sourcing teams that overlook this find their calculated risk profiles bearing little resemblance to floor reality.
When historical process averages drift toward specification ceilings, lot rejections surge along the curve. At that point, teasing apart statistical noise from genuine manufacturing failure requires tearing down physical assembly steps rather than staring at inspection logs. Importers who monitor process averages before they hit that boundary save themselves expensive commercial friction.
Rejecting a five thousand unit batch when the sample contains eleven major defects generates a false rejection probability of five percent under standard general inspection level two with an acceptable quality limit of two point five percent.
Choosing an inspection level shifts risk between buyer and seller. General Inspection Level II is the standard commercial default, balancing testing overhead against mutual risk. Dropping to Level I trims sample sizes and inspection hours, but it widens the window for both false rejections and false passes.
Stepping up to Level III tightens protection against sampling errors at the cost of heavier testing labor. Blindly specifying Level II without checking run volumes often misallocates quality resources. On high-ticket industrial parts, the cost of Level III sampling often pays for itself by preventing a single false rejection, making inspection tiering an essential pre-contract decision.
It remains questionable whether statistical limits established in manual sampling tables can remain relevant when machine-learning algorithms and automated visual scanners begin to evaluate every single component on the assembly line.


Bench
Pulling truly random samples from packed export pallets is harder than it looks on paper. When an inspector stands before skids of crated product, physical shortcuts corrupt the sampling math. Sampling exclusively from top-tier cartons reveals only the quality of the final minutes of a production run.
If a brief defect burst settled in those boxes, the inspection report flags an inflated nonconformity rate, rejecting a shipment clean everywhere else. A technician using calipers with a worn groove in the jaw face can easily misread critical dimensions and reject an entire run of compliant aluminum enclosures.
Physical Sampling Failures
Attribute plans assume defects are scattered evenly across a lot. If a temperature dip affects just fifty parts in a two-thousand-unit molding run and those parts end up boxed together, grabbing the nearest carton triggers a false rejection. Sound sampling requires pulling from the bottom layers of every skid ~ labor-intensive work inspectors often skip when containers are waiting to load.
As soon as the pull is rushed, sample representativeness collapses and false rejections climb. Specifying carton-randomization tables and auditing physical draws helps prevent this.
Ambient bench conditions can also throw off measurements. High humidity expands hygroscopic nylons, while an unheated winter staging room shrinks tight-tolerance steel pins below nominal limits. If test areas lack climate control, receiving inspection numbers diverge from factory inline data, leading to disputes over environmental variance rather than part quality.
These uncontrolled bench conditions cause a substantial share of false floor rejections, making environmental controls essential to protecting the sampling model.
- producer risk increases when the inspector selects samples exclusively from the top layer of a single shipping carton.
- producer risk rises during night-shift evaluations due to poor lighting on the inspection floor.
- producer risk becomes unmanageable if the calibration of measuring calipers deviates from the reference standard.
- producer risk remains high when the material drawing does not define the baseline for minor surface scratches.
Attribute Vs Variables Testing
Attribute testing evaluates parts on a strict pass-fail basis with go/no-go gauges or visual criteria. It is fast, but it throws away information on how close a feature sits to nominal dimensions. Variables testing records exact dimensions using digital micrometers or coordinate measuring machines, providing the mean and standard deviation needed to calculate actual process capability.
Because continuous data yields higher statistical confidence from smaller sample sizes, switching to a variables plan cuts the risk of false rejections without demanding huge sample draws.
The barrier to variables plans is the upfront investment in metrology tools and operator training. Gaging must be maintained and staff need to know how to record and interpret numerical distributions, which is often out of reach for smaller job shops. Buyers have to weigh that tooling cost against the downstream expense of unwarranted rejections and shipping disputes when choosing their quality framework.
Inspectors rushing through sampling to meet freight deadlines will almost certainly introduce sorting biases that skew the statistical validity of an entire batch evaluation.

Contract
Supply agreements establish the legal framework for quality acceptance, yet many contracts cite an acceptable quality limit without specifying underlying sampling mechanics. Naming a one point five percent acceptable quality limit without defining the inspection level, code letters, and reference standard (such as ISO 2859-1 or ANSI/ASQ Z1.4) creates major exposure. Without those parameters, a supplier has no recourse if an importer enforces a non-standard, severe sampling protocol that inflates rejection rates.
How Can Contracts Limit Producer Risk?
Well-drafted quality agreements define clear pathways for lots that fail an initial inspection. A standard clause allows the manufacturer to request joint re-inspection or third-party laboratory verification, protecting them against technician error or miscalibrated gauges at the receiving dock. These clauses generally include cost-shifting provisions: if independent testing proves the batch meets specification, the buyer takes the goods and absorbs the laboratory invoices.
This structure keeps initial testing rigorous on both sides.
Incorporate ISO 2859-1 Section 12 into the supply agreement to bind both parties to a pre-defined probability of lot rejection.
Agreements should also set out procedures for sorting and resubmitting rejected goods. When a lot fails on sampling statistics, the supplier usually retains the right to perform a rectifying inspection ~ sorting one hundred percent of the batch to pull and replace nonconforming units before resubmitting. The contract needs to state how many resubmissions are permitted and whether tightened inspection plans apply to reworked lots, heading off disputes before freight starts moving.
Under the provisions of the default manufacturing agreement, the buyer agrees that the cost of return transport for any lot rejected under normal inspection levels remains the sole responsibility of the importer if a third-party audit subsequently proves the lot meets the agreed quality limit.
Dock
When an incoming lot fails inspection at the port of entry, statistical risk converts immediately into physical logistics costs. Rejected containers cannot sit on the discharge apron; they move into bonded storage or container yards while claims are negotiated, accumulating daily demurrage and detention charges that can outstrip the value of the freight itself.

Logistical Consequences of Rejection
Staging rejected cargo at the port also threatens downstream assembly schedules. If the stalled shipment contains critical subassemblies, the entire plant risks a shutdown. Faced with that scenario, sourcing teams frequently accept marginal lots and sort them on-site at their own expense rather than leave stock stranded in port.
While this sidesteps the formal sampling decision, it keeps lines fed when rigid rejection protocols would cause worse operational damage.
- Locate the staged shipping container within the bonded terminal area.
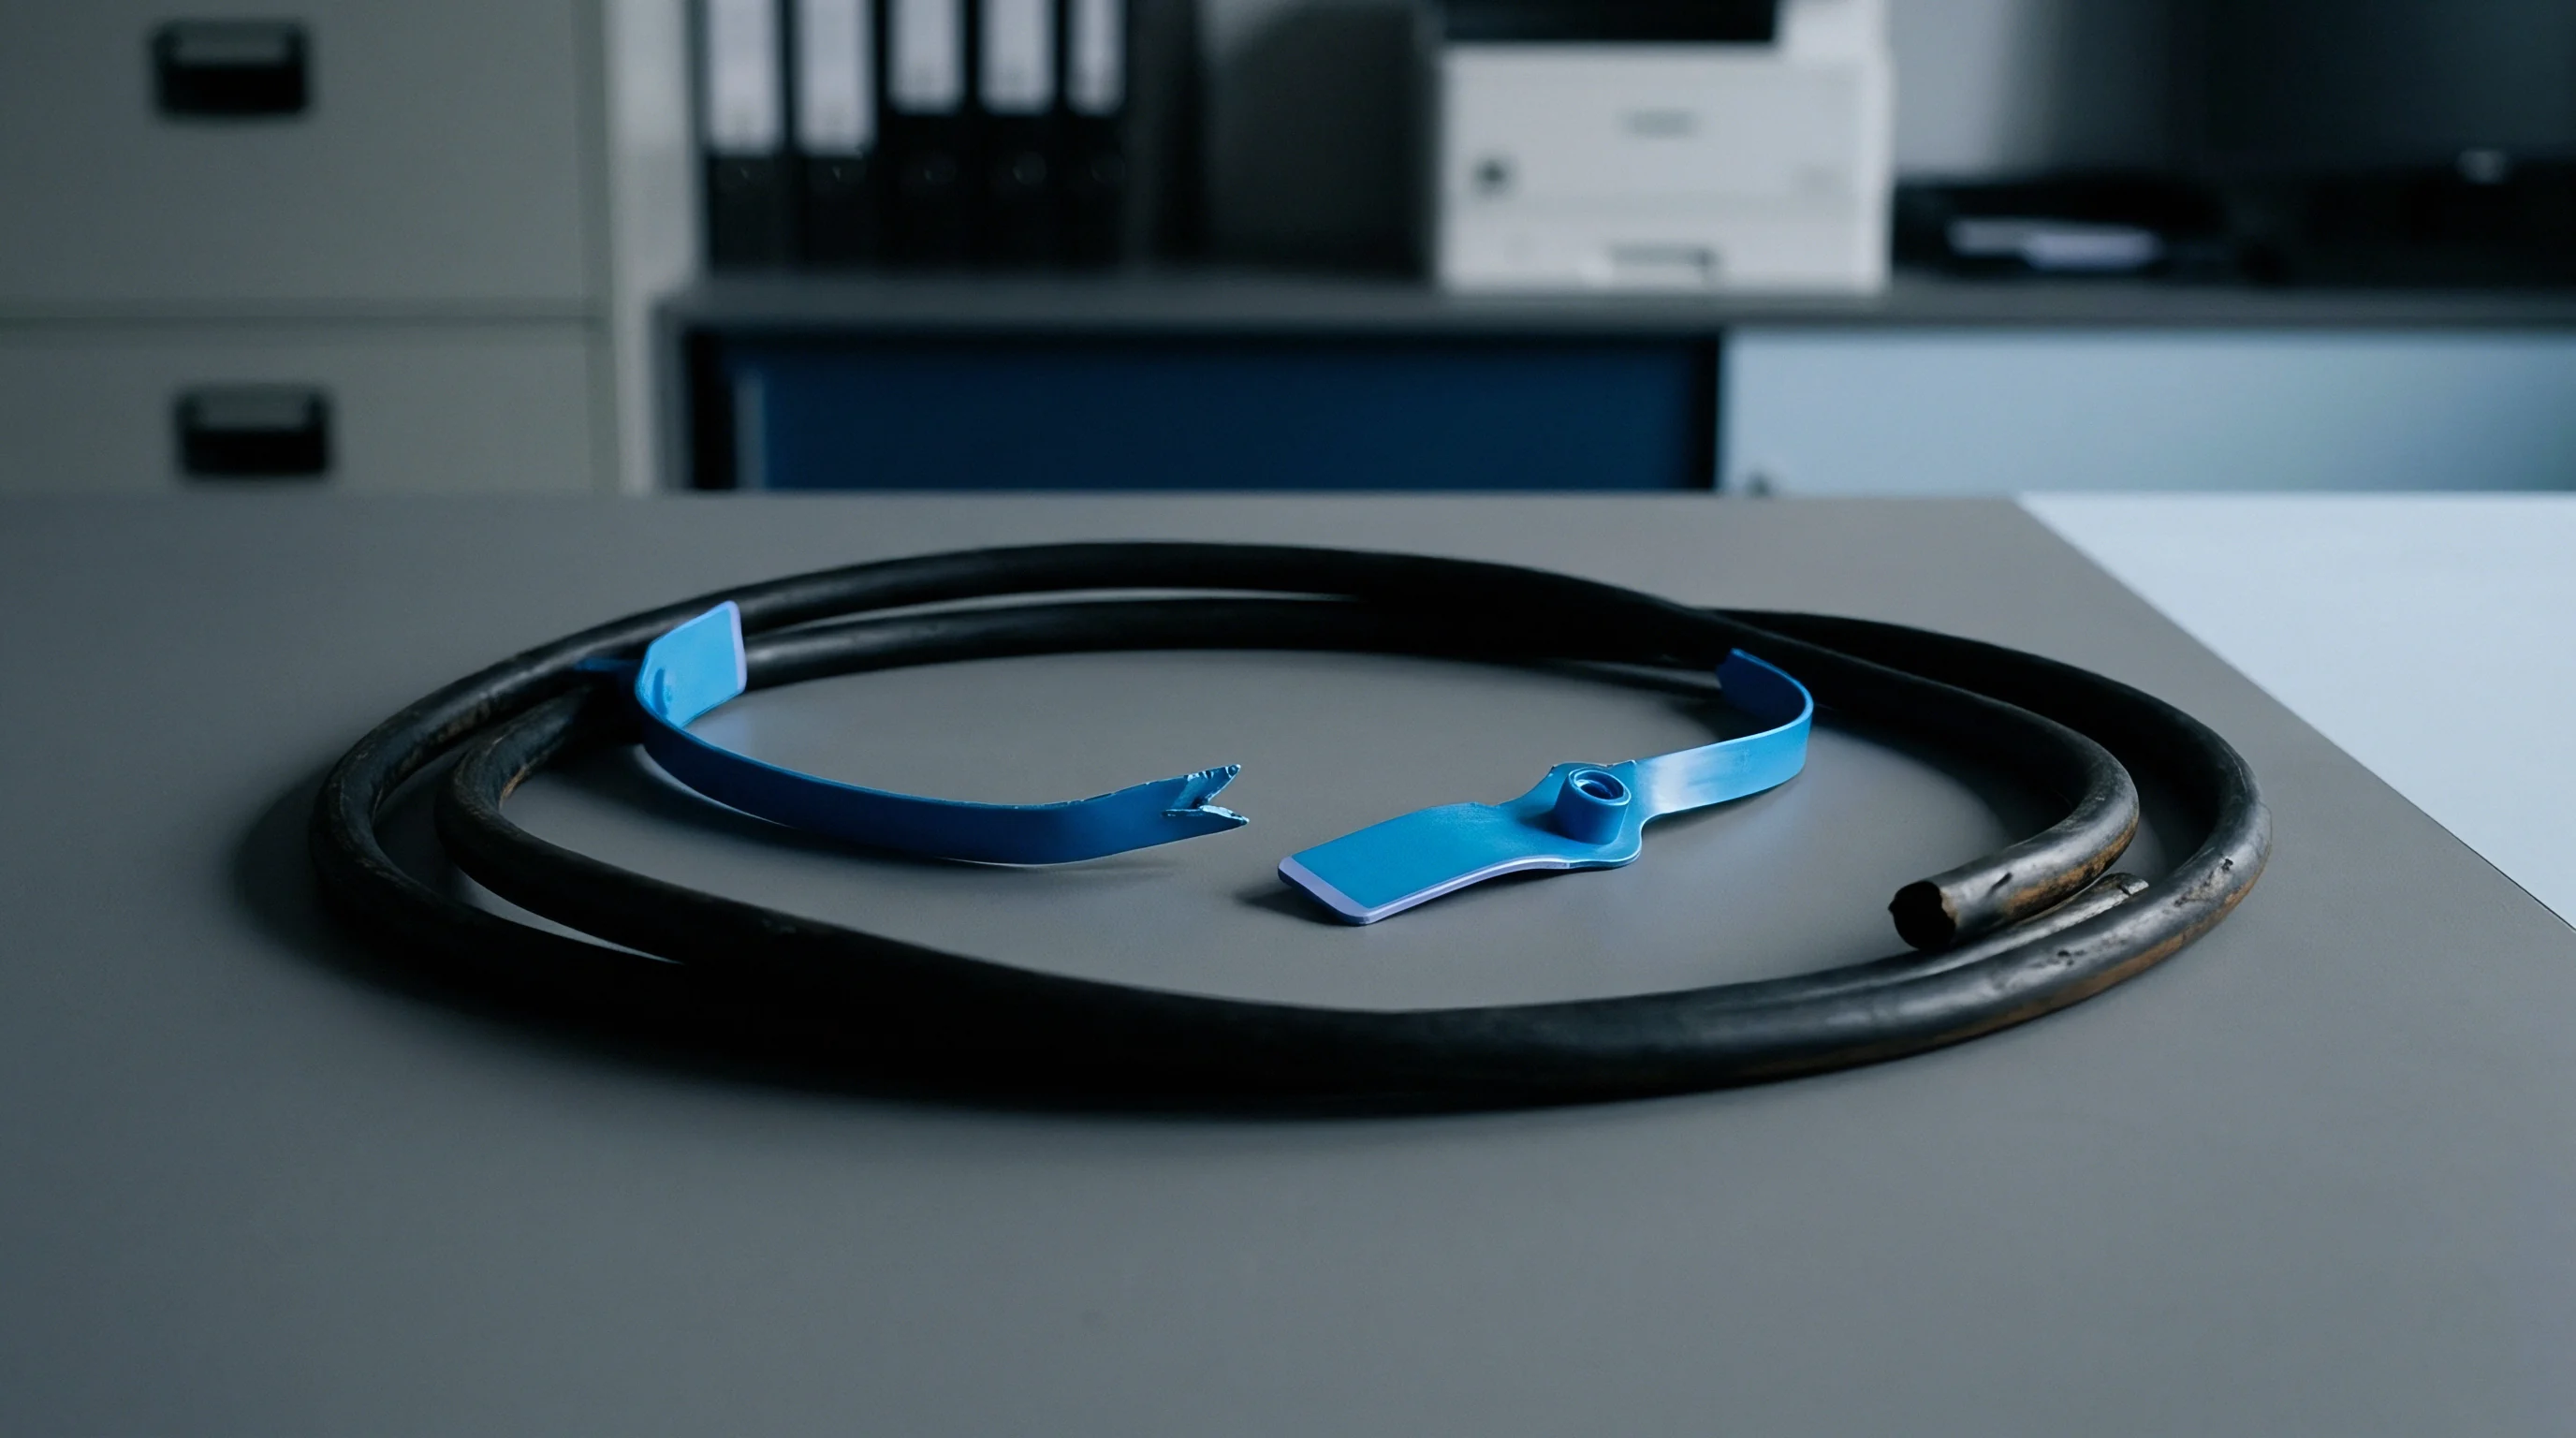
- Verify that the customs seals are intact and match the numbers recorded on the bill of lading.
- Draw twenty boxes from the central pallets to avoid biased sampling.
- Deliver the drawn parts to the terminal laboratory for destructive stress testing.
Customs Holding and Duty Drawback
Turning away freight that has already cleared customs creates an administrative headache around duties and taxes. Reclaiming paid duties requires a duty drawback filing supported by original entry documents, rejection test logs, and export bills of lading showing the goods left the country. Recovering those funds takes months, tying up operating cash in the interim.
Sourcing teams need forwarders who know return-to-origin procedures thoroughly to limit damage from contested shipments.
Terminal warehouse humidity, rather than manufacturing flaws, can cause surface finishes on aluminum casings to oxidize prior to inspection.


Ledger
The financial impact of a quality rejection reaches far beyond scrap costs. Between inspection hours, return ocean freight, financing costs on frozen capital, and administrative time spent processing claims, an unwarranted rejection penalizes the vendor heavily. Sourcing organizations running high-volume programs must account for these friction costs when designing quality procedures.
Amortization and Unit Economics
False rejections hit thin-margin suppliers especially hard. Many lack the cash reserves to absorb a stranded container, which can disrupt production or threaten solvency. When an importer’s sampling framework carries high producer risk, suppliers simply bake that exposure into higher unit quotes to cover expected losses.
The buyer ends up paying for loose statistical planning through inflated piece prices.
Aligning the sampling plan with the factory’s proven process capability prevents these unneeded markups. When inspection intensity reflects historical capability, false rejections drop and total landed costs stabilize. Achieving this balance takes transparent data-sharing, which can be hard to establish across borders, but the savings make it worthwhile for high-volume programs.
When the production run is small, inspection budgets are better spent on process control than on high-volume sampling.
Mapping the total exposure of a rejection requires tracing costs across every node of the supply chain. The following matrix shows typical direct labor charges and freight liabilities across different sampling plan failure modes, illustrating the split between statistical risk and gage drift.
| Inspection Scenario | Statistical Failure Mode | Direct Labor Charge (USD) | Transit Liability Party |
|---|---|---|---|
| False Lot Rejection | Producer Risk (Alpha) | 2400 | Consignee Sourcing Division |
| Mislabeled Lot Release | Consumer Risk (Beta) | 15000 | Original Manufacturing Partner |
| Calibrating Error Rejection | Instrument Drift | 1200 | Third Party Testing House |

Working Capital and Cash Flow Impacts
Payment holds during quality disputes freeze capital on both sides. Importers routinely hold invoices on contested shipments while testing is redone, leaving suppliers unable to purchase raw material for upcoming production runs. Importers face their own squeeze if funds were drawn against an open letter of credit while they wait on replacements.
Clear dispute timelines in purchase agreements keep these holds from turning into broader supply disruptions.
Spending five thousand dollars on an independent retest of a shipping lot of zinc-coated brackets can prove that initial rejects resulted from a faulty testing fixture rather than supplier negligence.


Dispute
Conflicting laboratory reports and gage calibration offsets trigger most vendor disputes. When a batch fails receiving inspection, suppliers routinely question whether samples were pulled correctly, whether sample sizes met the standard, or whether technicians operated equipment properly. Without a defined dispute protocol in the master agreement, these arguments drag on indefinitely.

Resolving Sampling Discrepancies
Joint inspections at the factory or an accredited third-party lab offer the cleanest resolution. Working side-by-side lets both teams observe the pull, verify gage calibration, and execute the test protocol together under agreed parameters. Pre-agreeing on sample selection rules and testing steps removes ambiguity from isolated receiving reports, keeping negotiations focused on verified data.
Importers frequently absorb the financial burden of retesting to avoid the complete loss of a long-term supplier relationship.
Subjective pass-fail criteria also drive frequent commercial friction. Buyers and suppliers often disagree on cosmetic standards for molded plastics ~ where a factory views a light flow line as acceptable, receiving inspection may tag it as a major defect. Specifying visual acceptance with physical limit boards and high-resolution boundary photo cards removes this ambiguity before production starts.
- producer risk can be calculated using the operating characteristic curves of both laboratories to pinpoint the source of discrepancy.
- producer risk justifies the cost of a joint inspection conducted at a neutral, accredited testing facility.
- producer risk disputes require a review of the historical process capability indexes of the production line.
- producer risk calculations shift significantly when transitioning from attributes to variables sampling plans for continuous measurements.

The Role of Arbitration
When informal talks break down, contracts must point to clear arbitration rules and venues to avoid jurisdictional deadlocks. Cross-border agreements typically name forums like the International Chamber of Commerce or the Singapore International Arbitration Centre. Because arbitration takes months and costs tens of thousands of dollars in legal fees, it remains a mechanism of last resort when cargo value justifies the expense and the commercial relationship is beyond saving.
Analyzing six months of shipping logs can show that a supplier’s process capability indices consistently exceed sampling plan expectations. Relying on this historical performance data allows teams to negotiate a transition to a reduced inspection plan, lowering false rejections and restoring trust between parties. Using data-driven arguments and statistical evidence, importers and suppliers can resolve quality disputes in a collaborative manner that protects commercial interests.